
How to monitor a 24 hour global event
For the last three years, Xpirit and Solidify organize the Global DevOps Bootcamp, an online event that teaches people about the DevOps practices using Microsoft technologies. As the name global implies, the event takes place on the same day for around 100 venues all over the world. It started in New Zealand and ended about 24 hours later on the west coast of the USA.
As organizers, we were located roughly in the middle, the Netherlands, from which we wanted to keep track of what was happening and making sure the infrastructure was holding up.
This year, there were a lot of moving parts involved. A couple of days before the event, we had provisioned a large number of both Azure resources as well as AzureDevOps projects. My colleague, Rob Bos, has more details about this part on this blog.
During the event itself, we had a couple of parts;
- A challenges website which was used by the participants to read about the different challenges and to provide the ability to start and stop them.
- The backend that was able to start containers which are used to control the disruption as well to influence the scoring.
- A scoreboard to bring some competition into play.
Issues with any of these components could bring the user experience down or even made it hard for the people to do the challenges. Although we had communicated workaround for when elements were failing, it would be a shame if they could not be used as intended.
Keeping track of users
We wanted to know what the users (or actually teams, we had accounts per team) were doing during the day. For this, we used two different systems; Google Analytics and Application Insights. Adding Google Analytics is relatively easy. The code to add is provided by Google and can be added to the _layout.cshtml master layout like this
<script async src="https://www.googletagmanager.com/gtag/js?id=UA-141001163-1"></script>
    <script>
      window.dataLayer = window.dataLayer || [];
      function gtag() { dataLayer.push(arguments); }
      gtag('js', new Date());

      gtag('config', 'UA-141001163-1');
</script>
For Application Insights, you will need to do a similar action, by adding the code shown in their documentation to the master page.
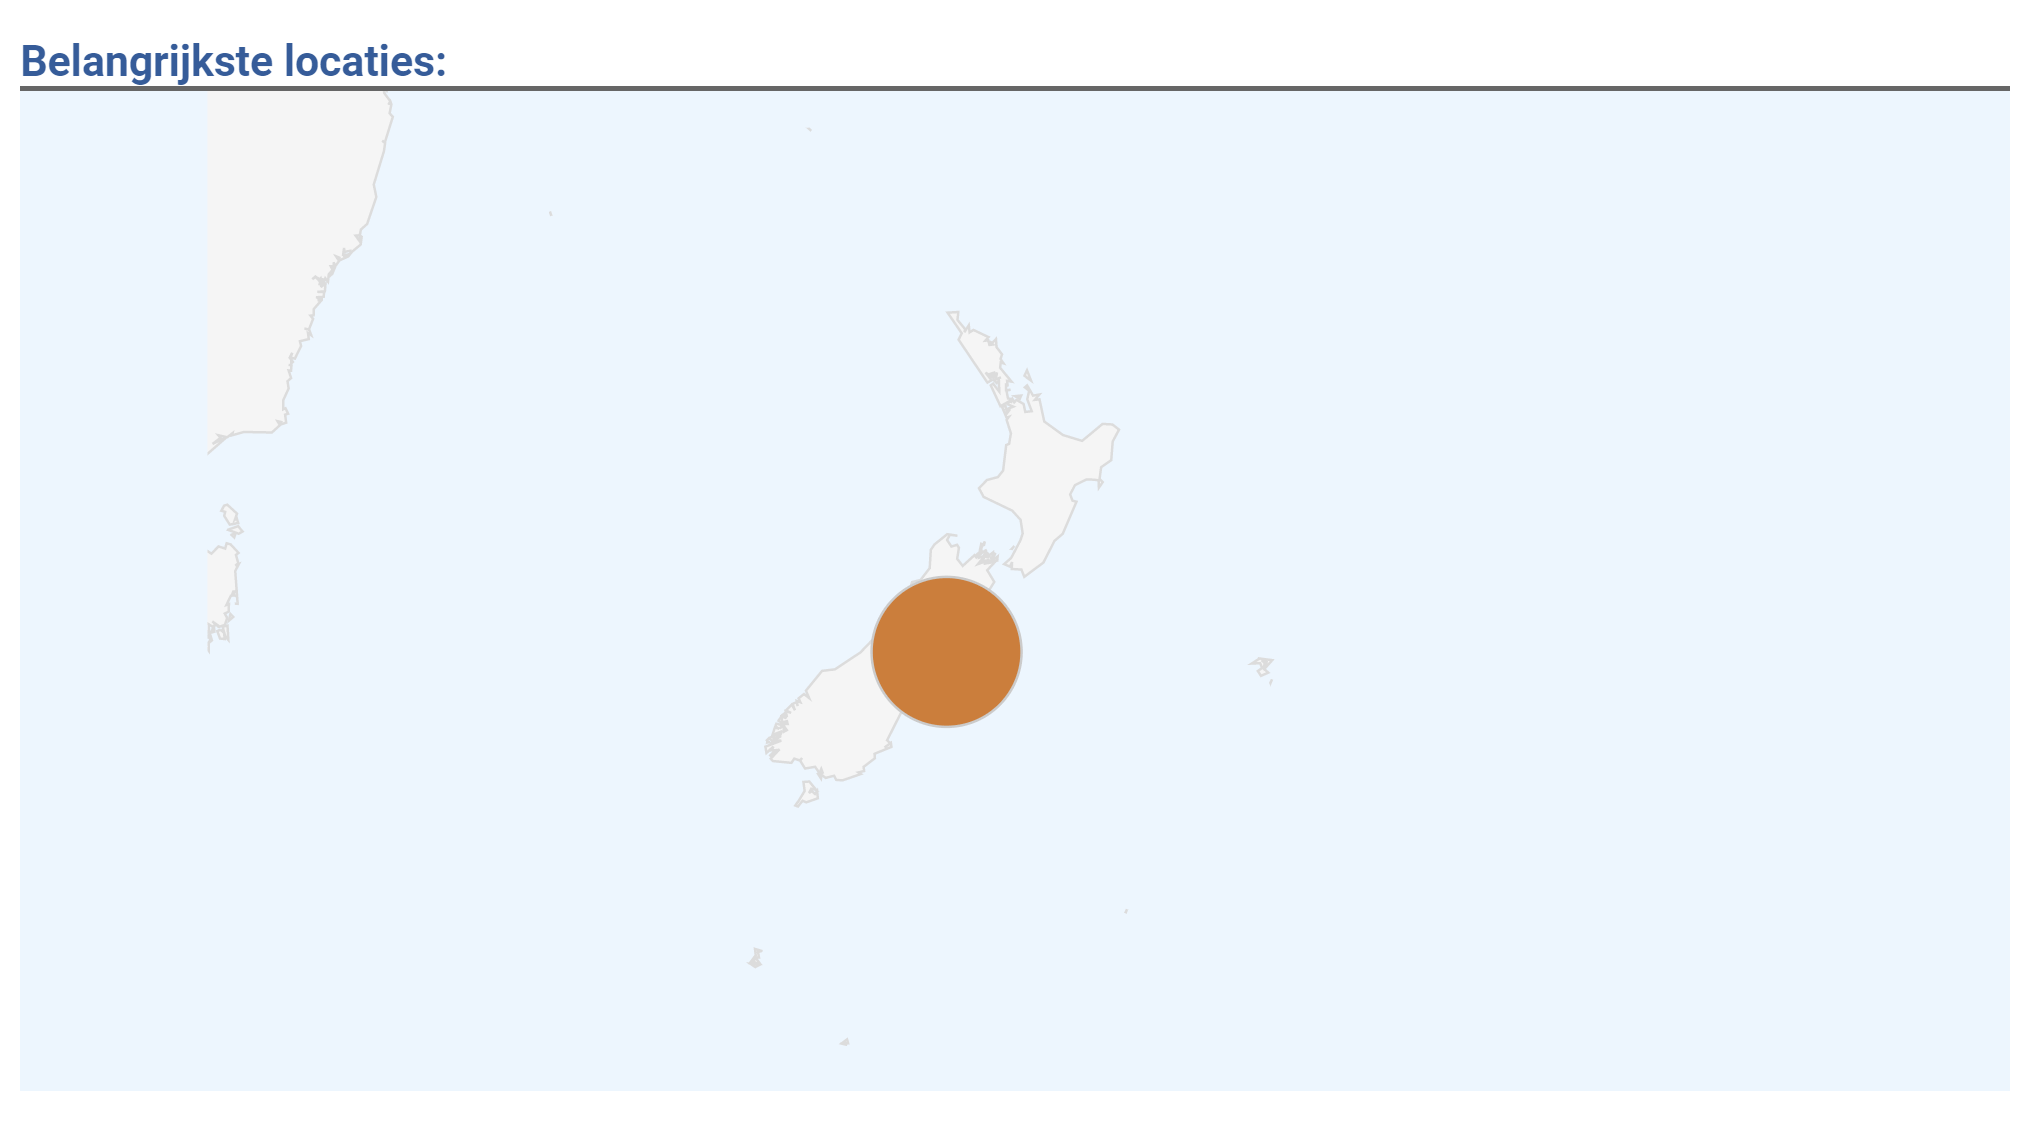
The Google Analytics has some great dashboards that even allows you to see real-time usage of your site and from where the request originated from. So at the start of the event, New Zealand was clearly the first to come online.
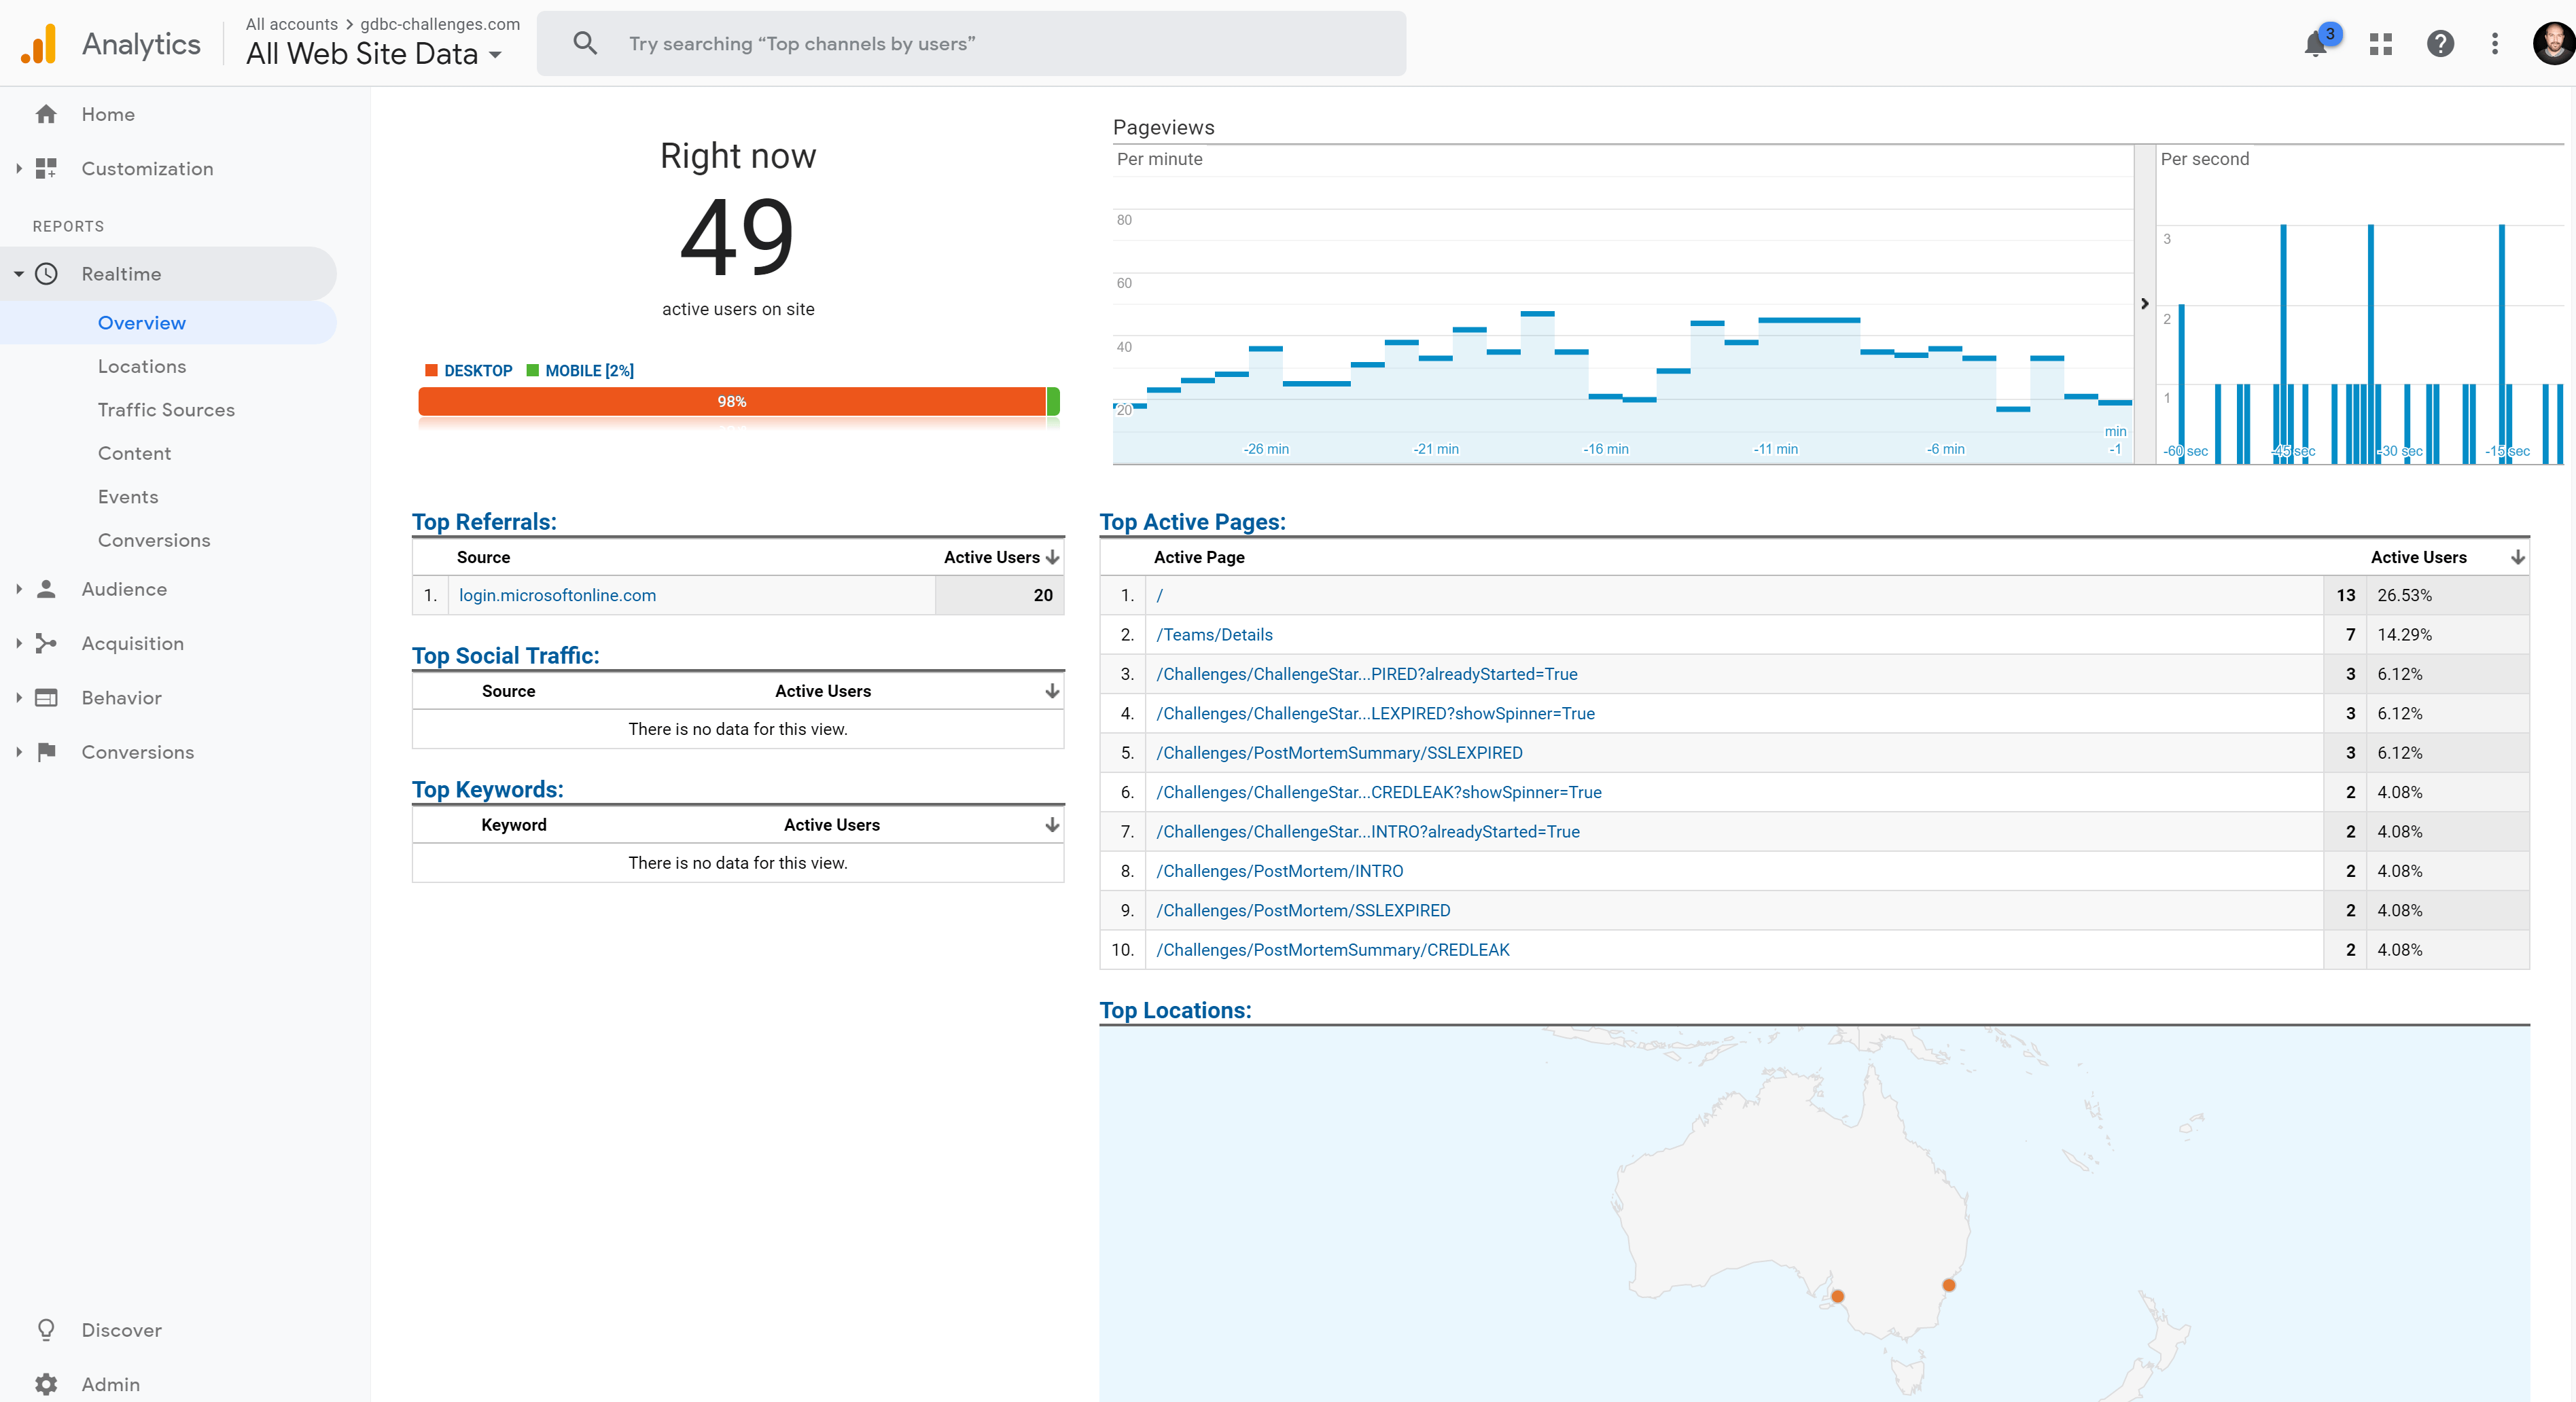
It also allowed us to see which pages are requested. Since we had the details of the challenge inside the url, we could see which ones started.
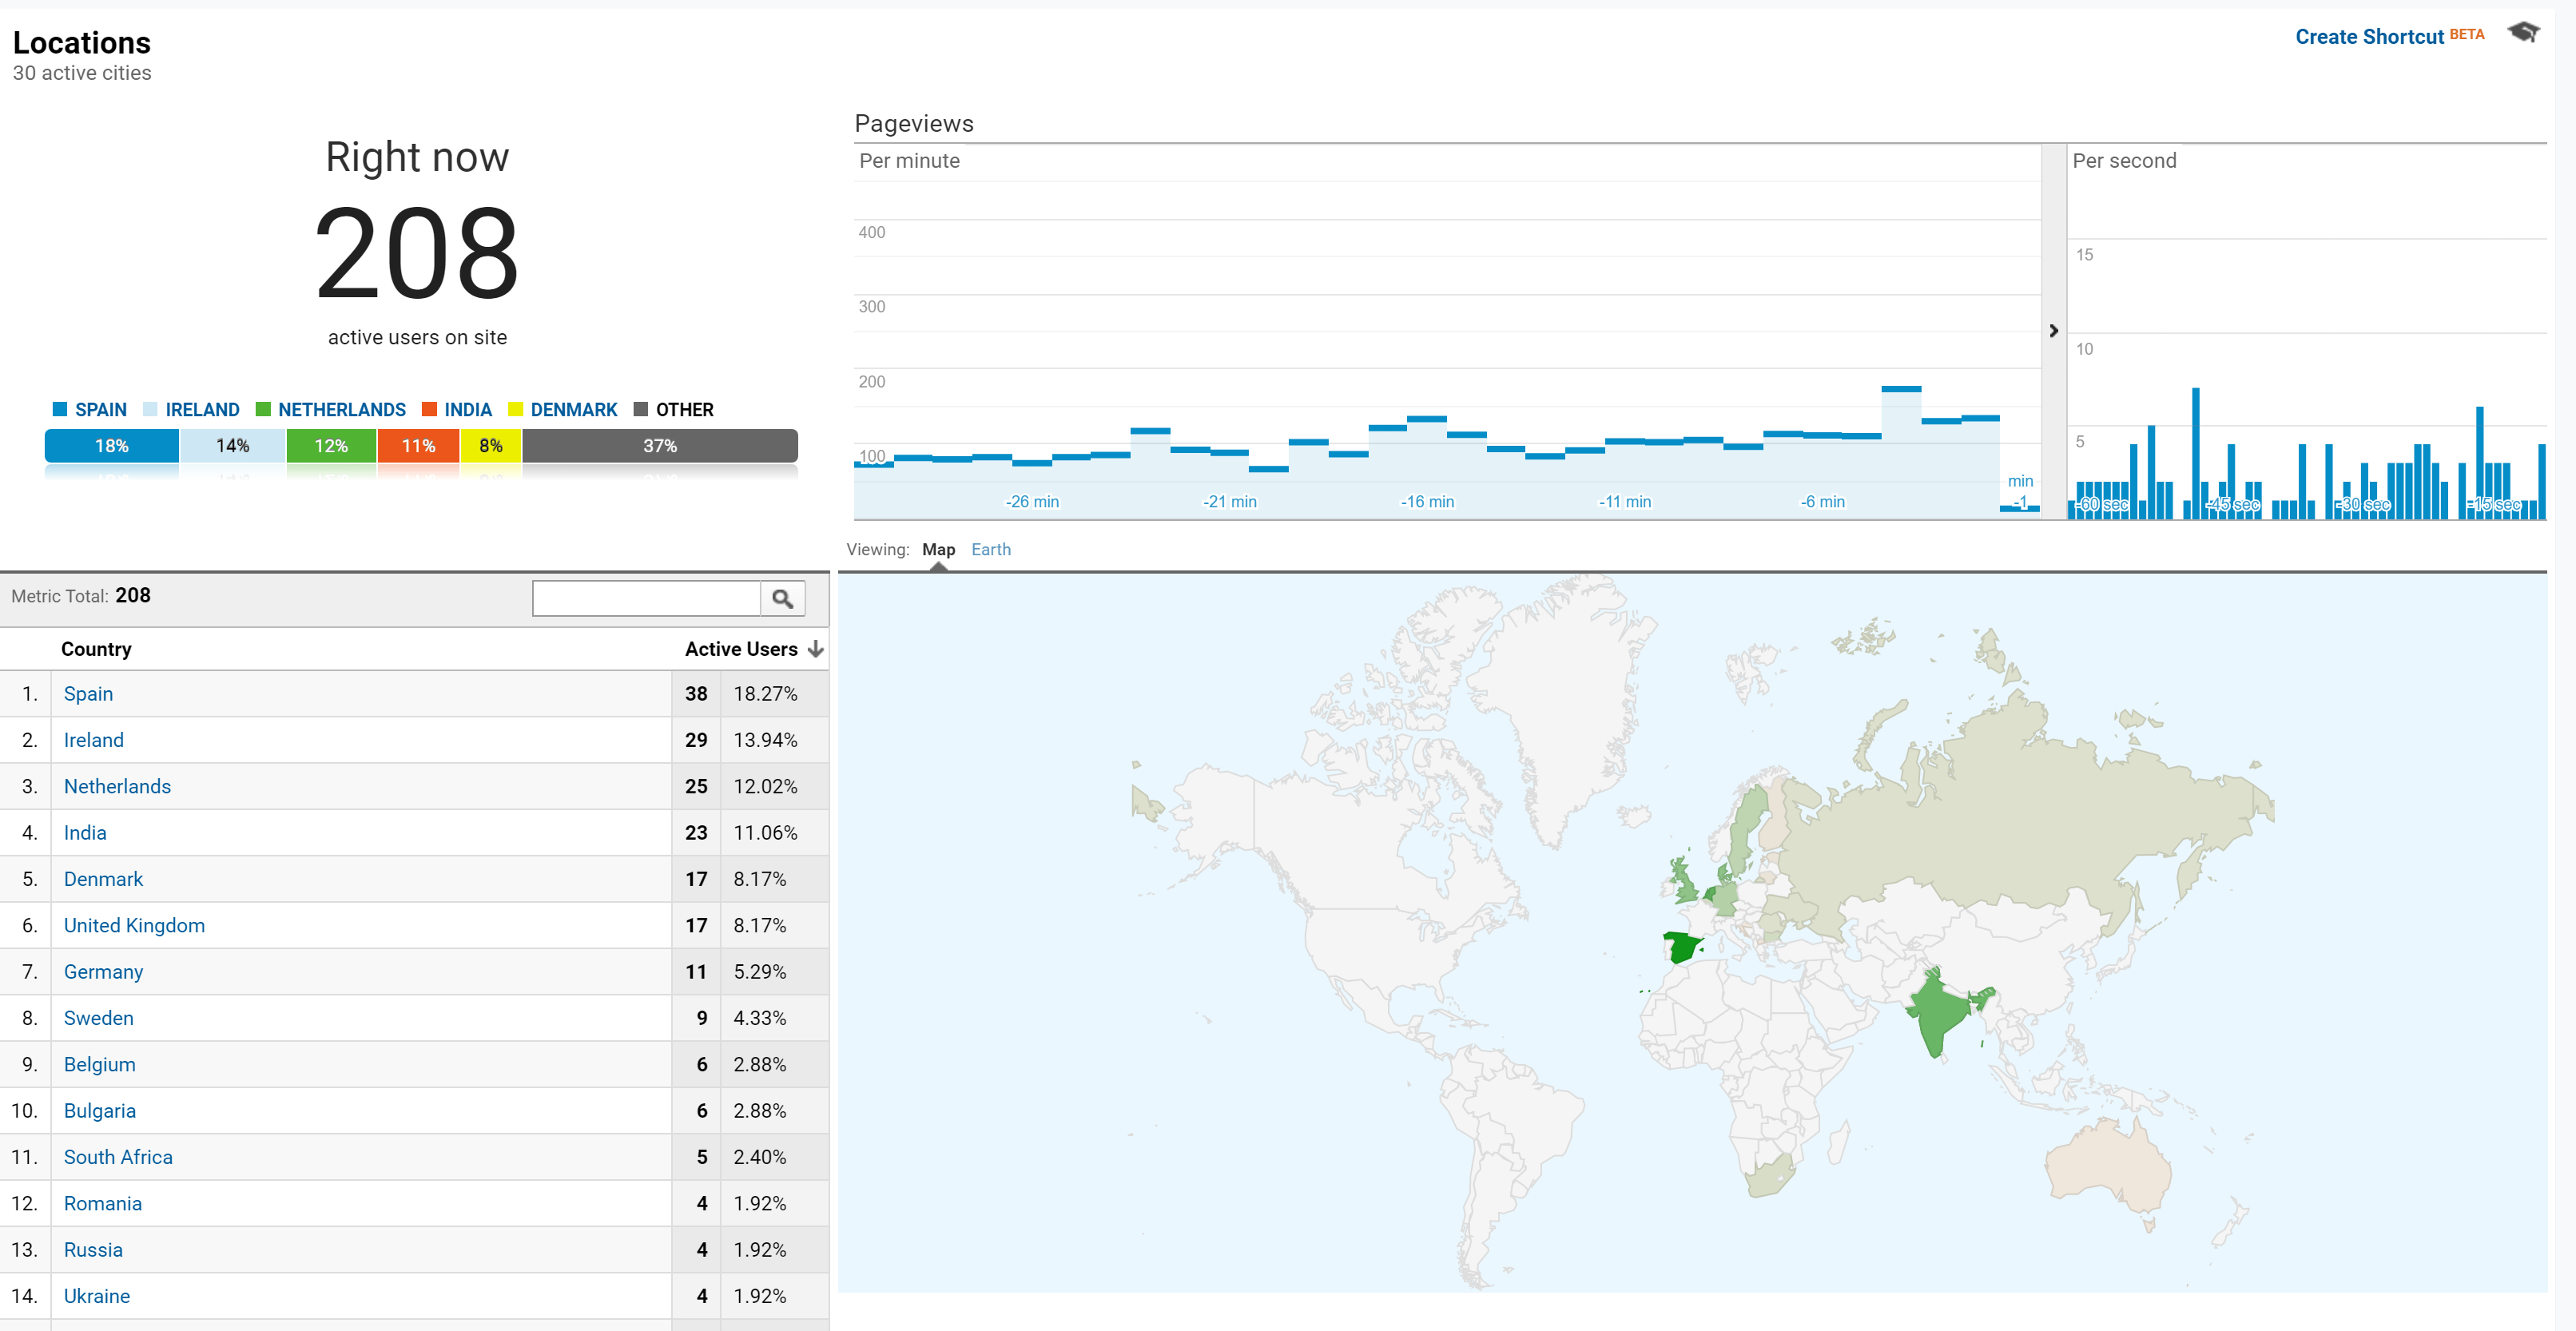
During the day, we nicely noticed the user location change along from Europe.
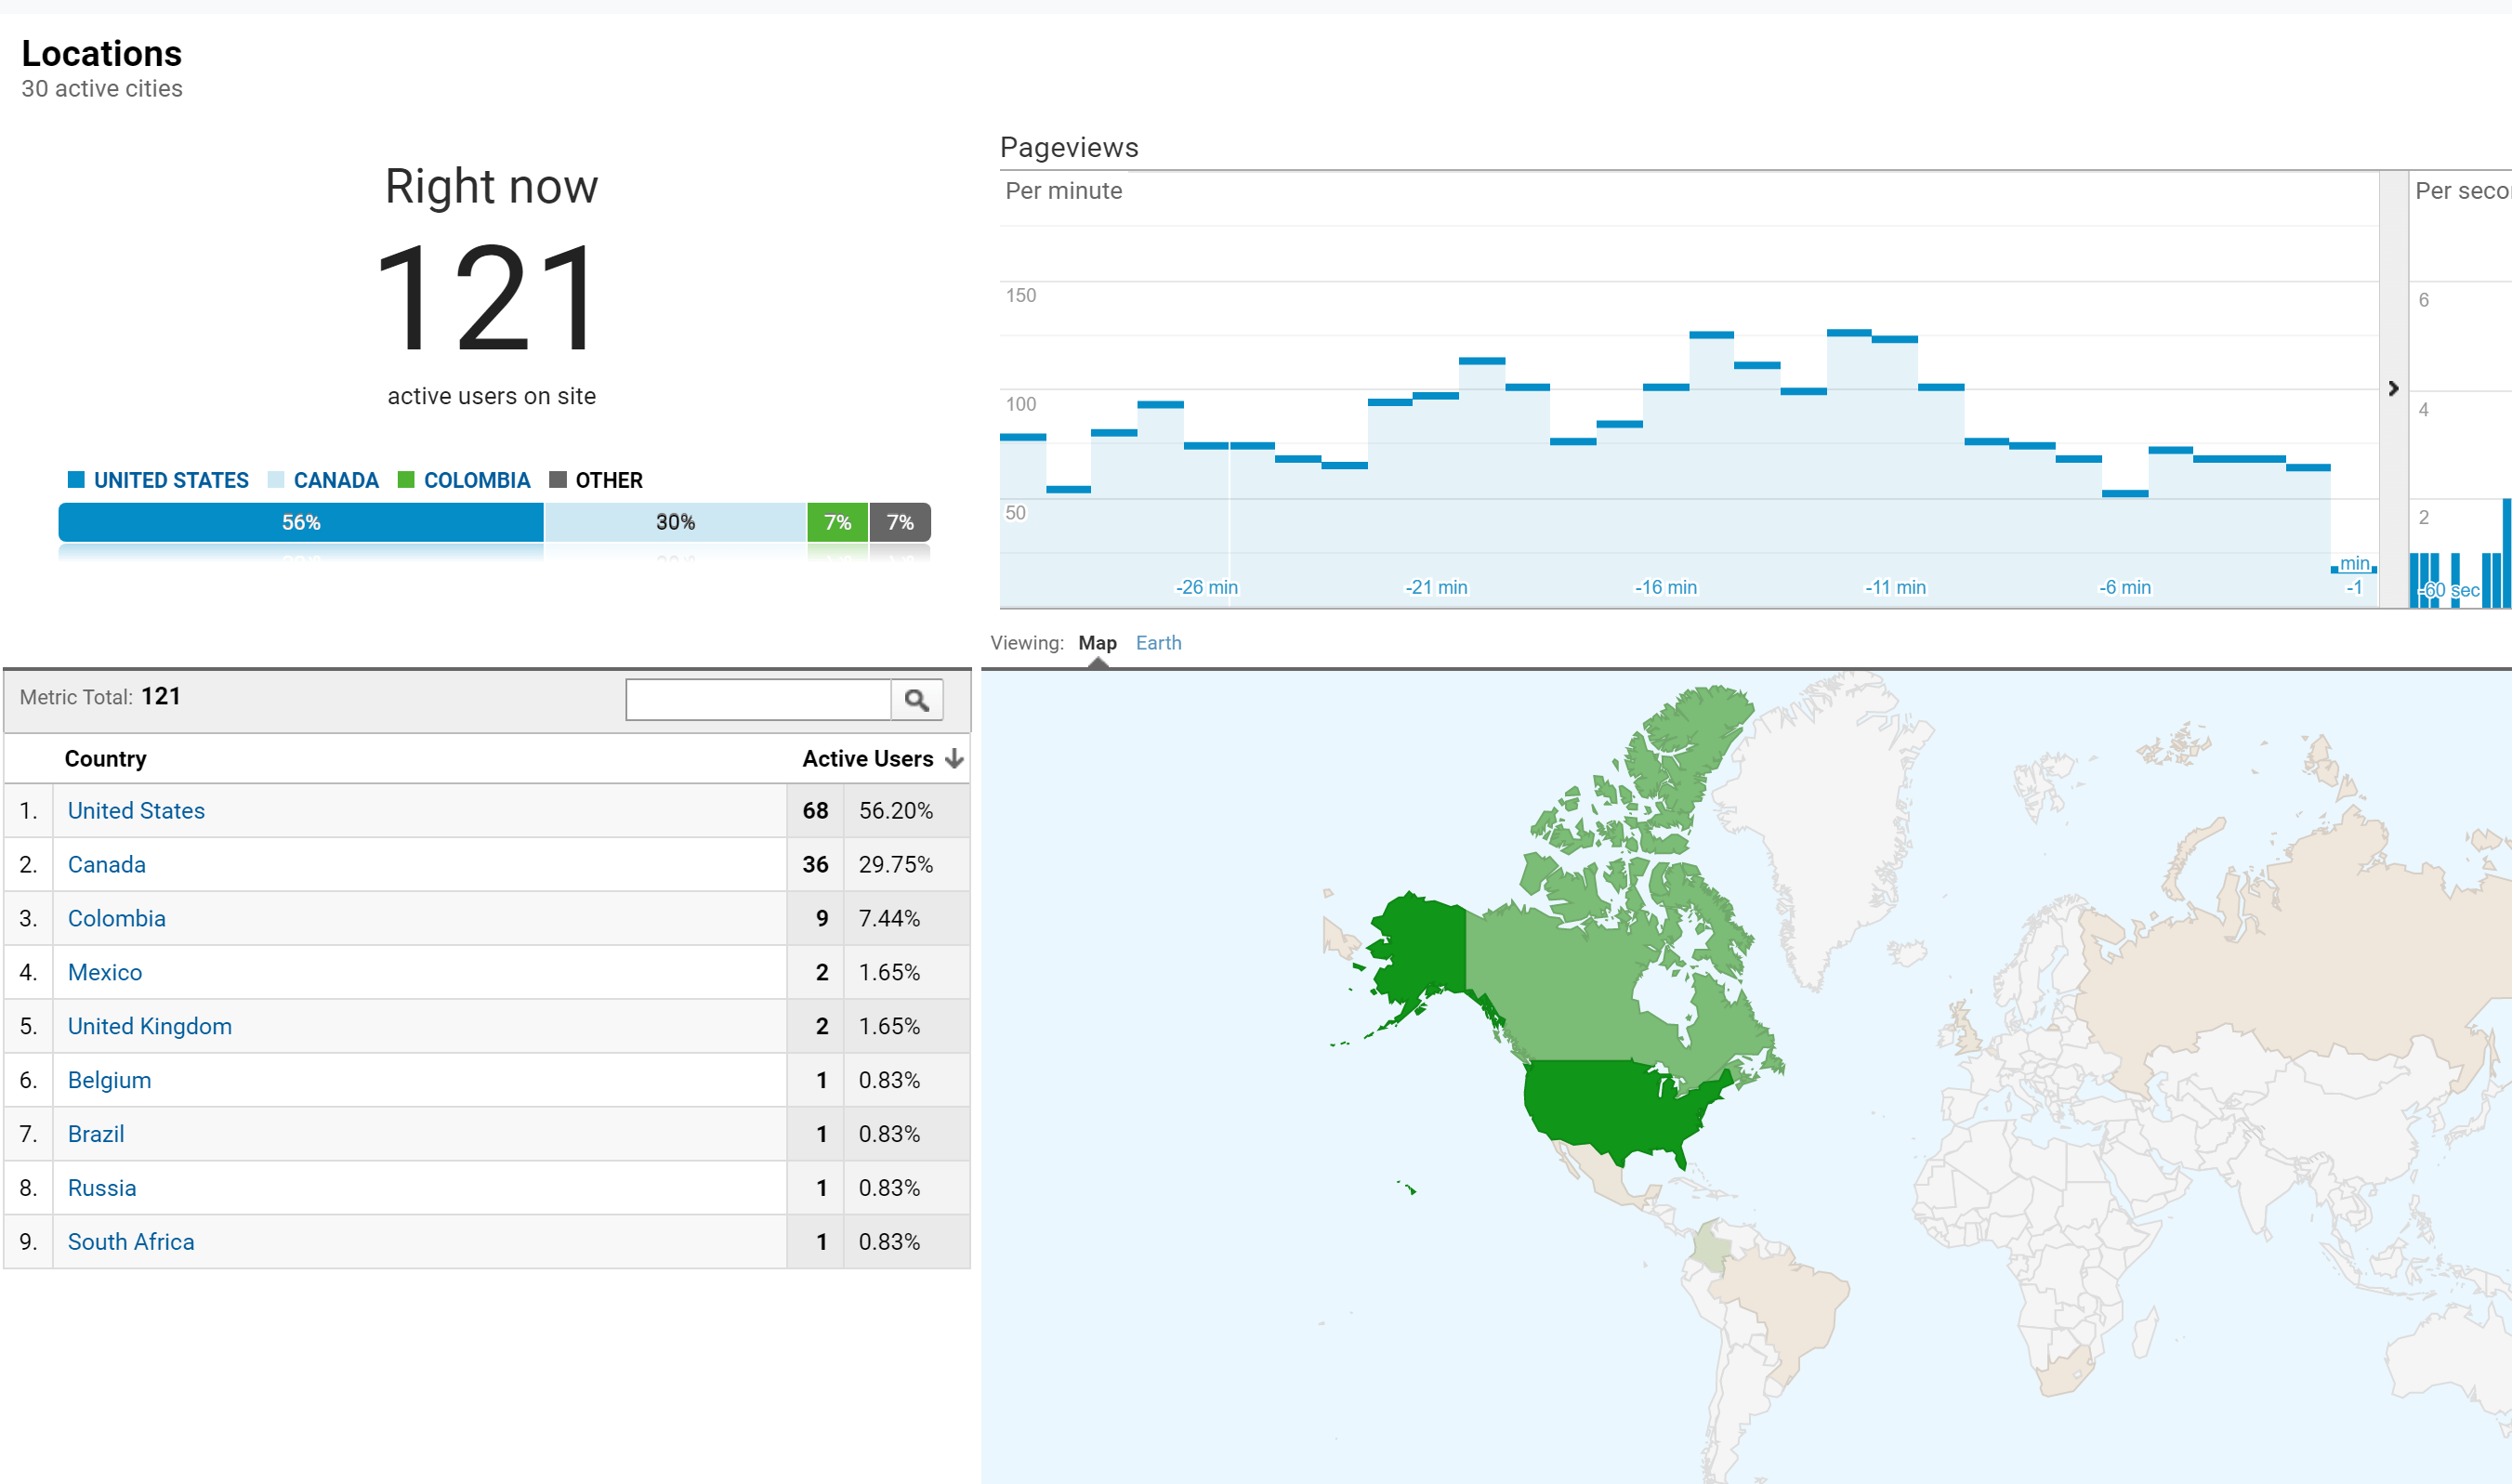
To the America continent
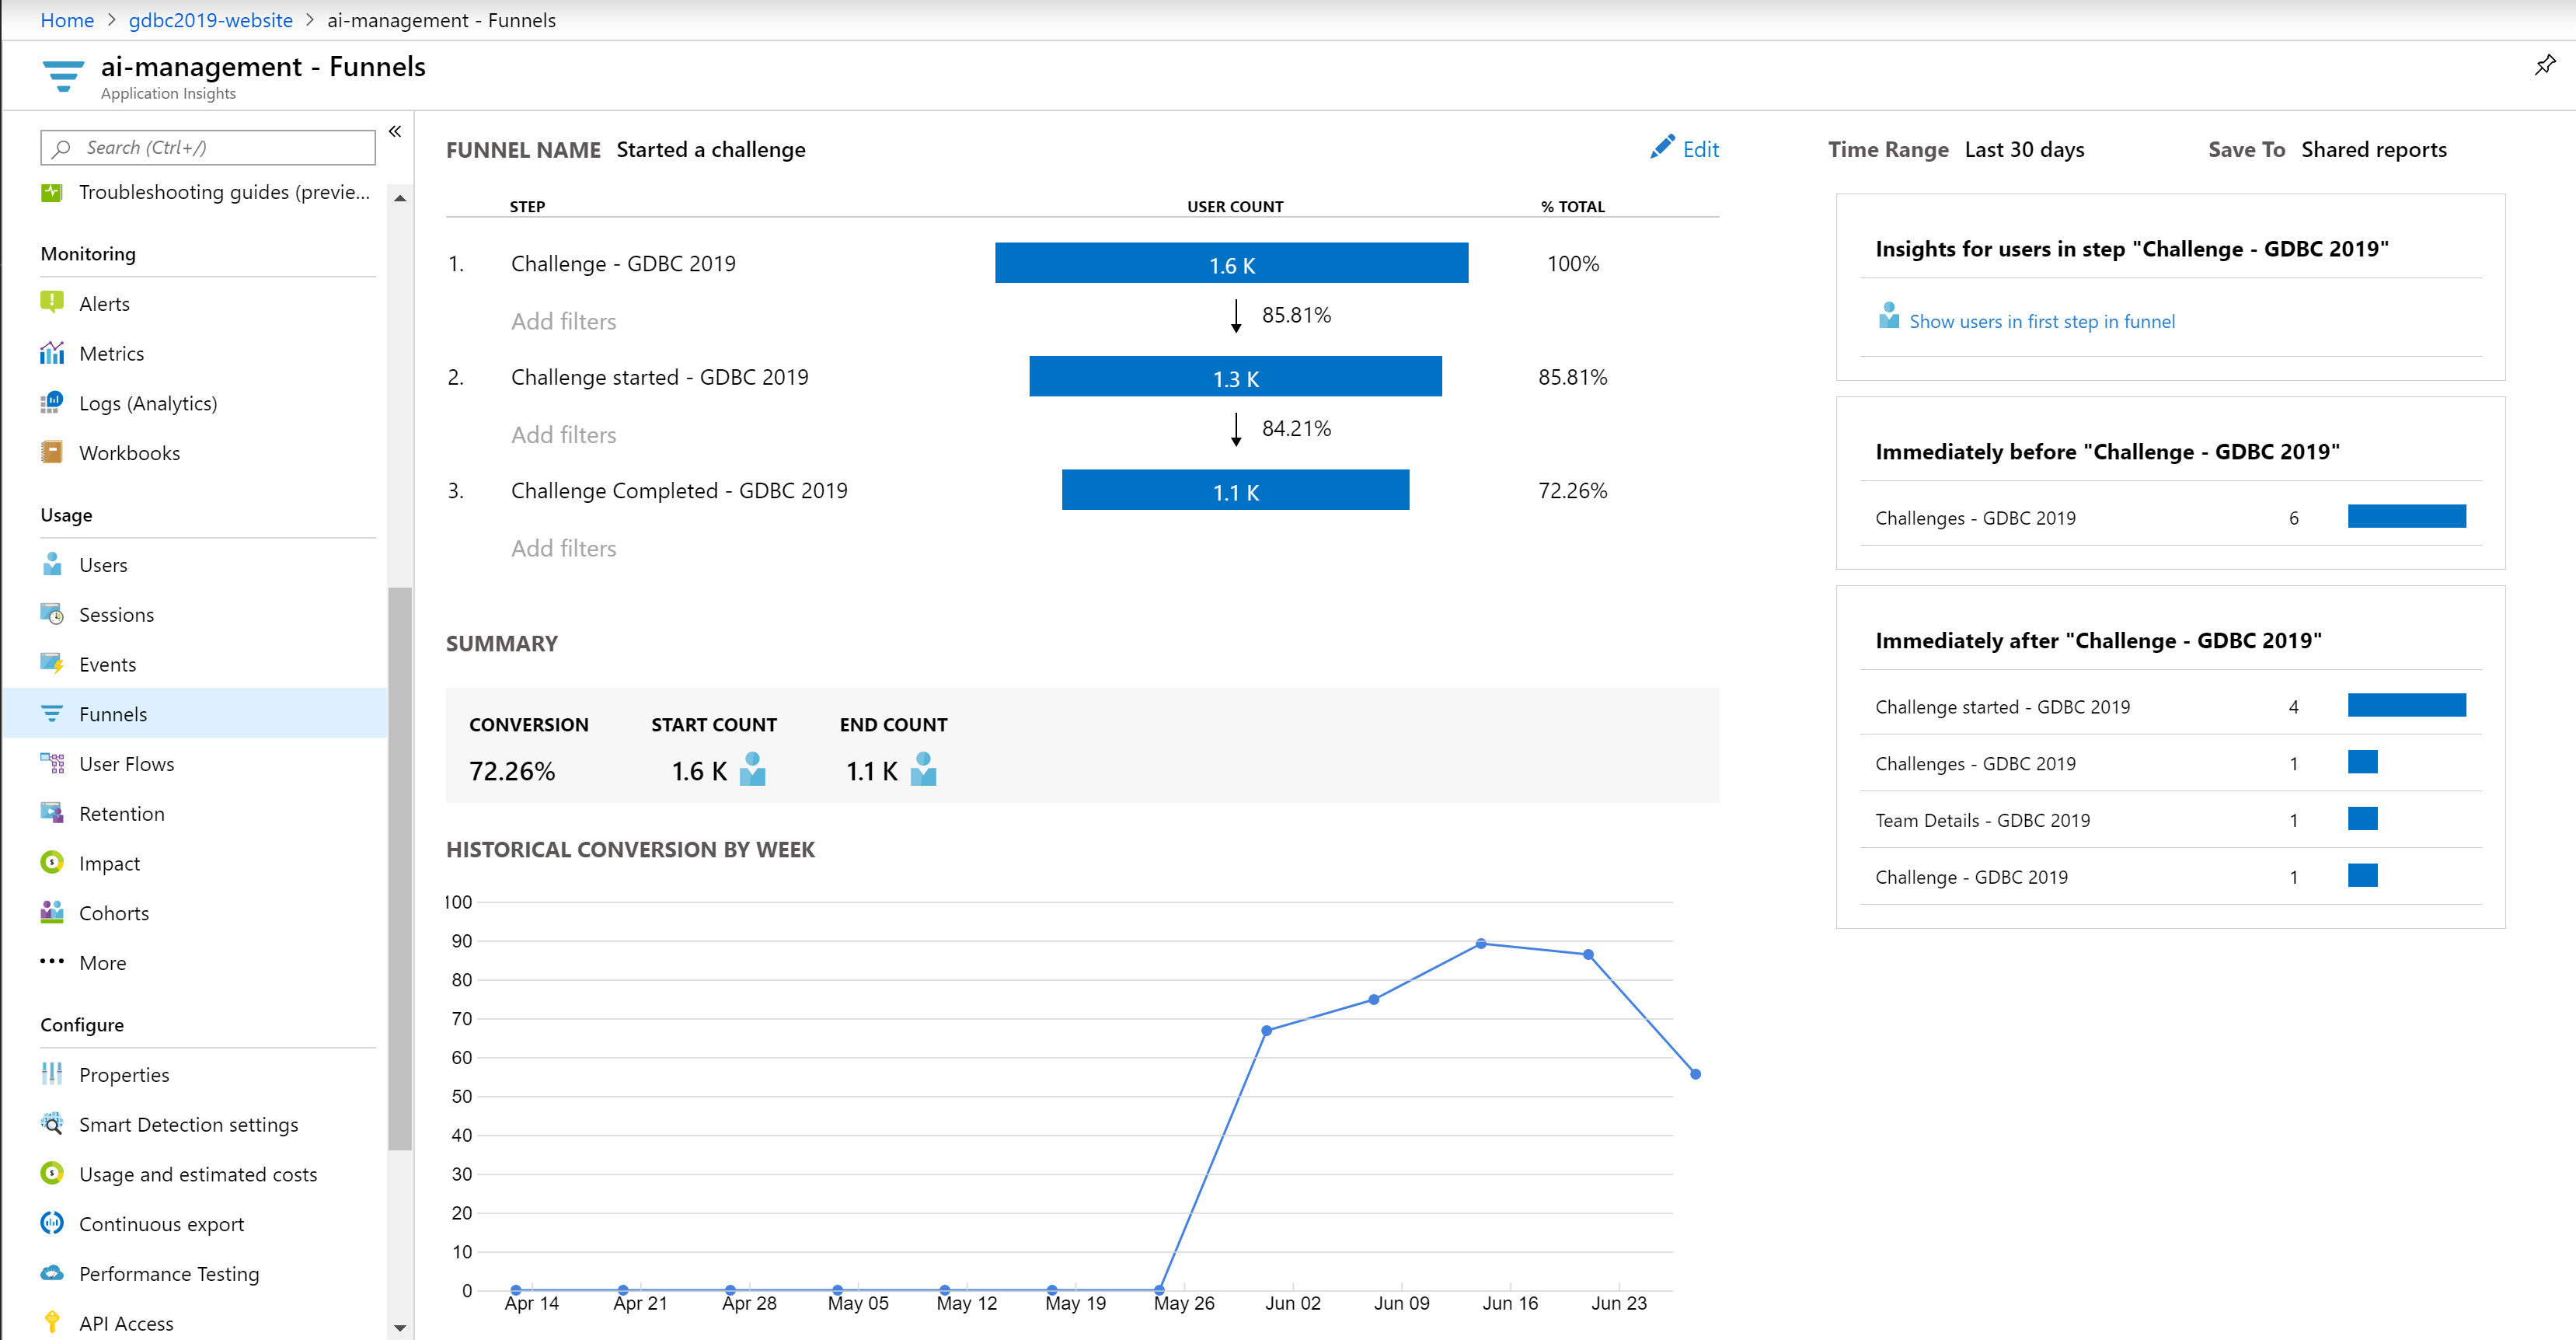
Application Insight was also keeping track of the users, which allowed us, for example, to make funnels to see if users not only looked at the challenges but also started them and completed them.
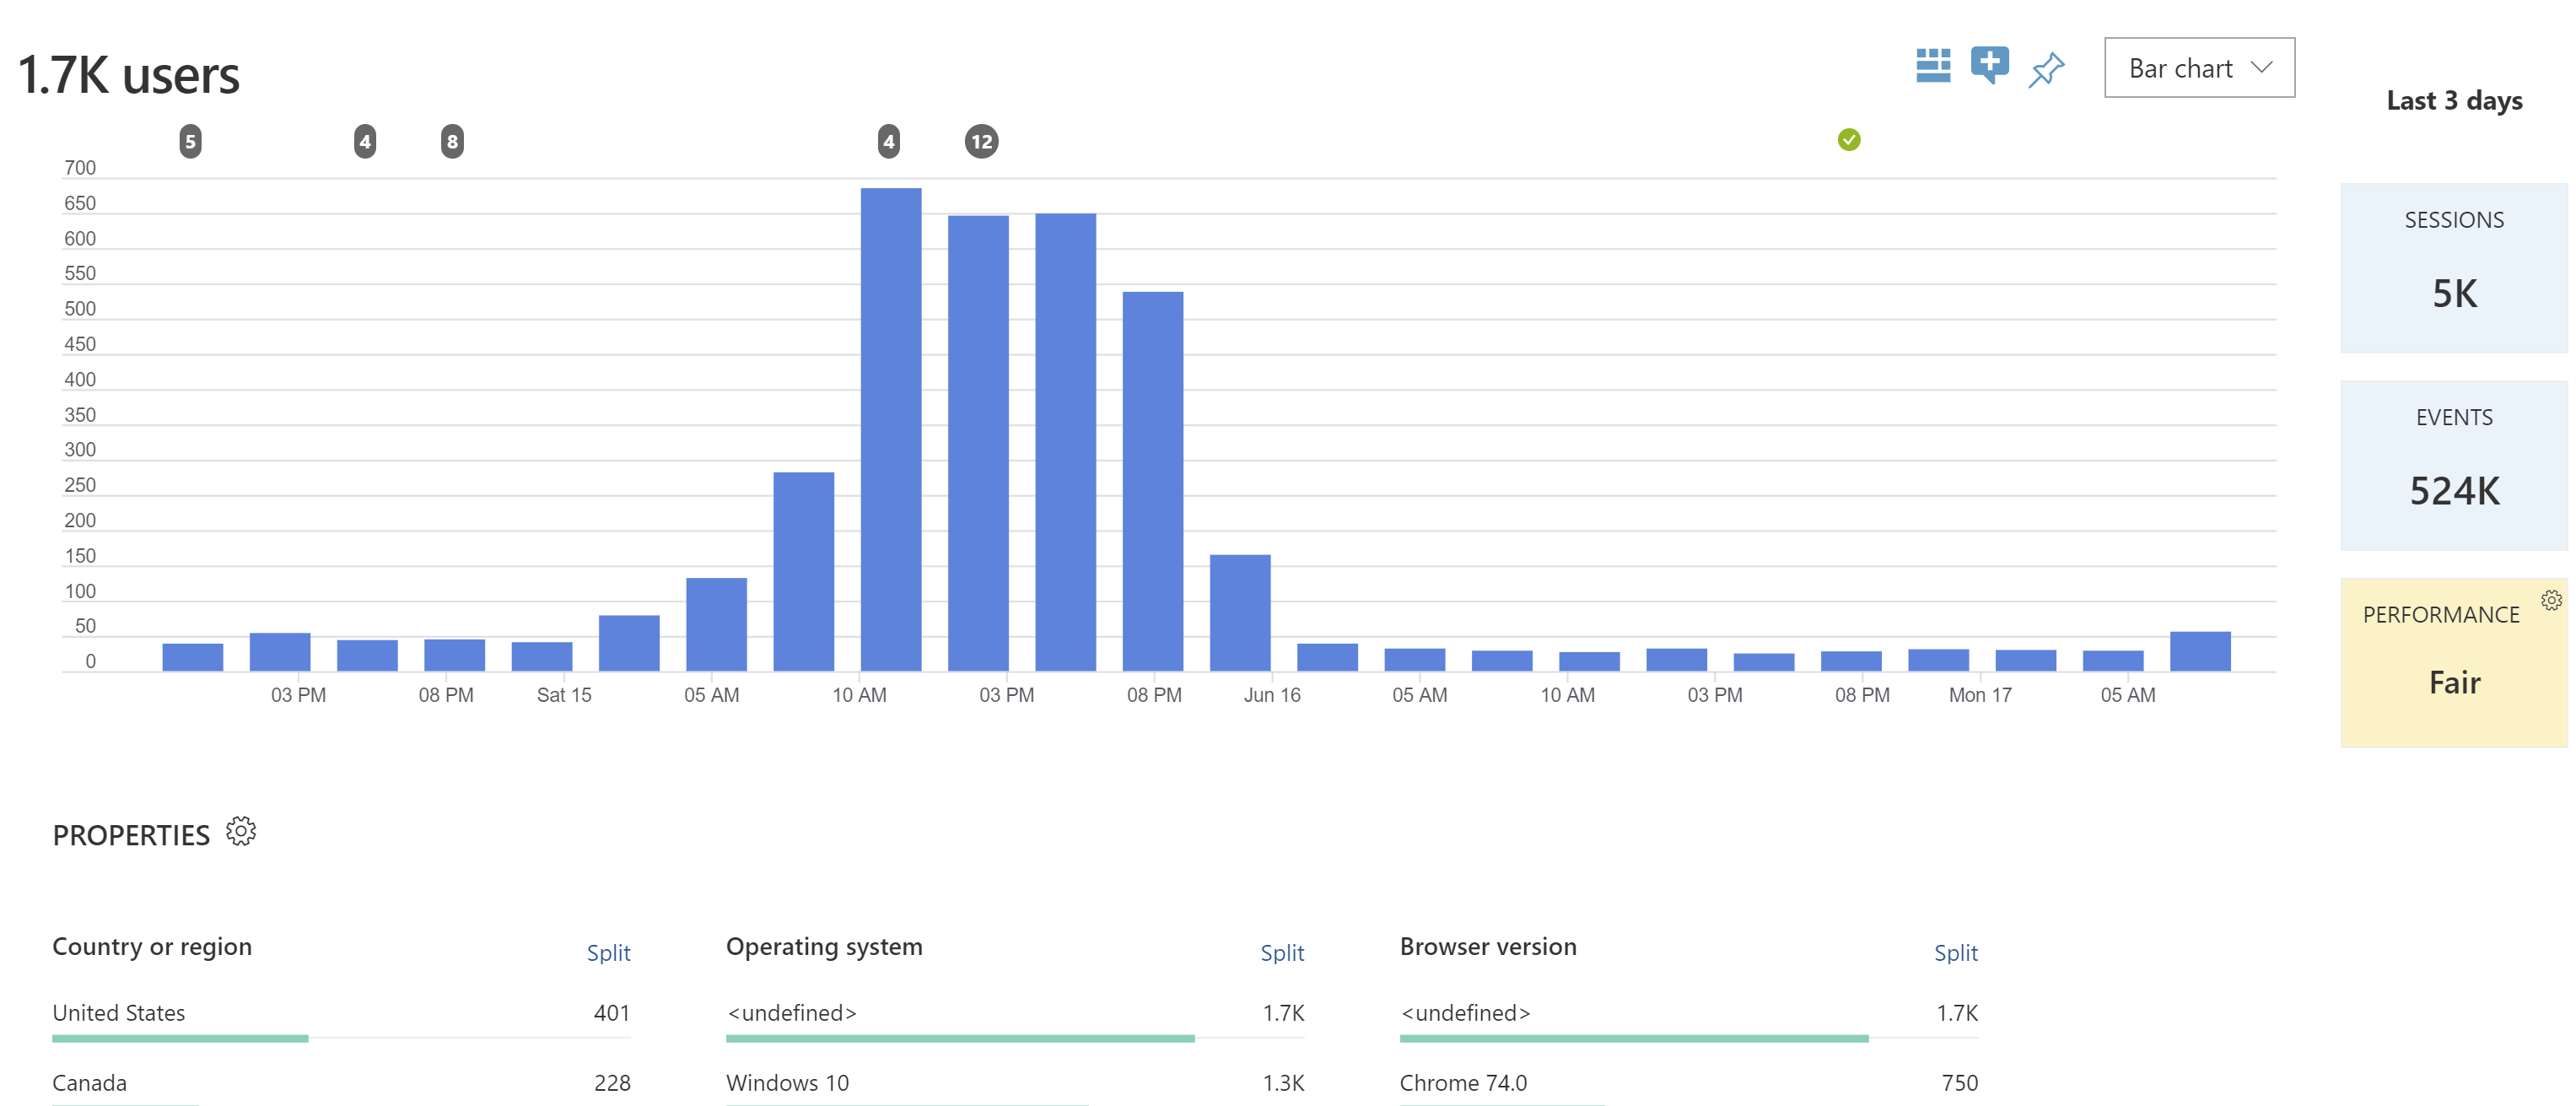
Also, after the event itself, we could retrieve a lot of interesting information from both systems; for example, the number of users per hour. The numbers are the top are the deployments that took place during the event. We needed to roll out some enhancements to the UI and text to all our web services (multiple per 4 region).
Keeping track of the application
We also need to make sure we knew what the application was doing. All the telemetry and log data were sent to Application Insights. The application map proved to be very efficient to see where issue popped up.
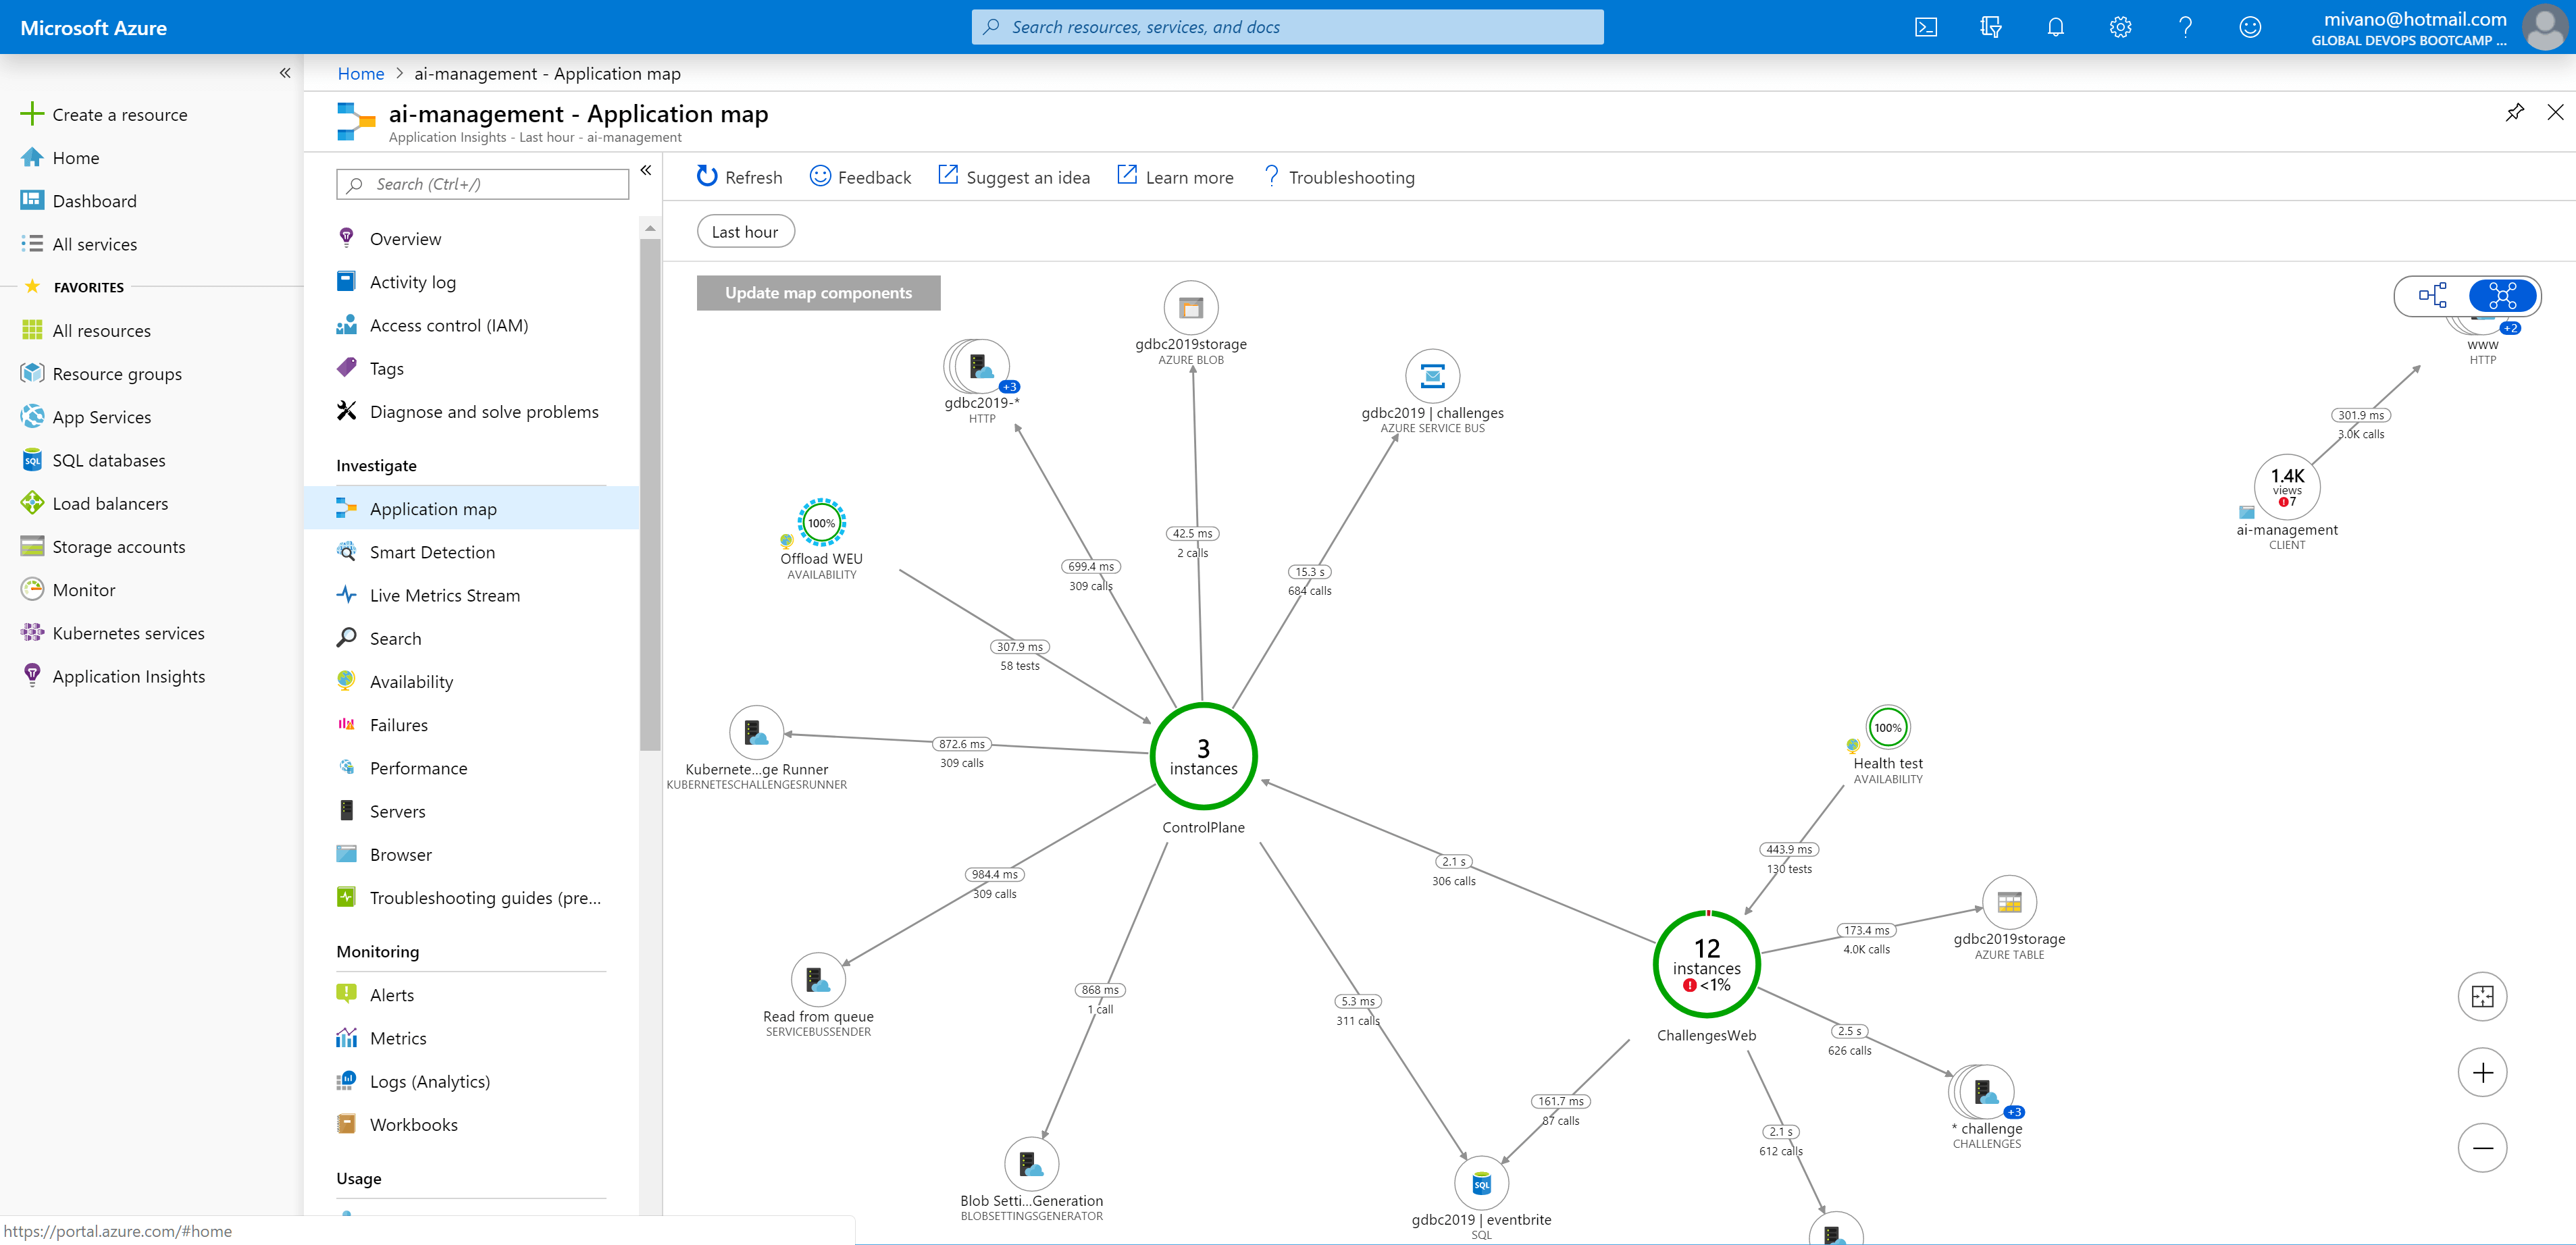
By providing cloud role names, the different deployments were nicely condensed into one entry. You can do this by adding a telemetry initializer.
/// <summary>
/// Initializer for telemetry
/// </summary>
[DebuggerStepThrough]
public class ServiceNameInitializer : ITelemetryInitializer
{
    /// <inheritdoc />
    public void Initialize(ITelemetry telemetry)
    {
        telemetry.Context.Cloud.RoleName = "ChallengesWeb";
    }
}
Register this in the ConfigureServices so it is available for AppInsights
services.AddSingleton<ITelemetryInitializer, ServiceNameInitializer>();
We even noticed some strange dependencies inside our web application, which the tooling had picked up.
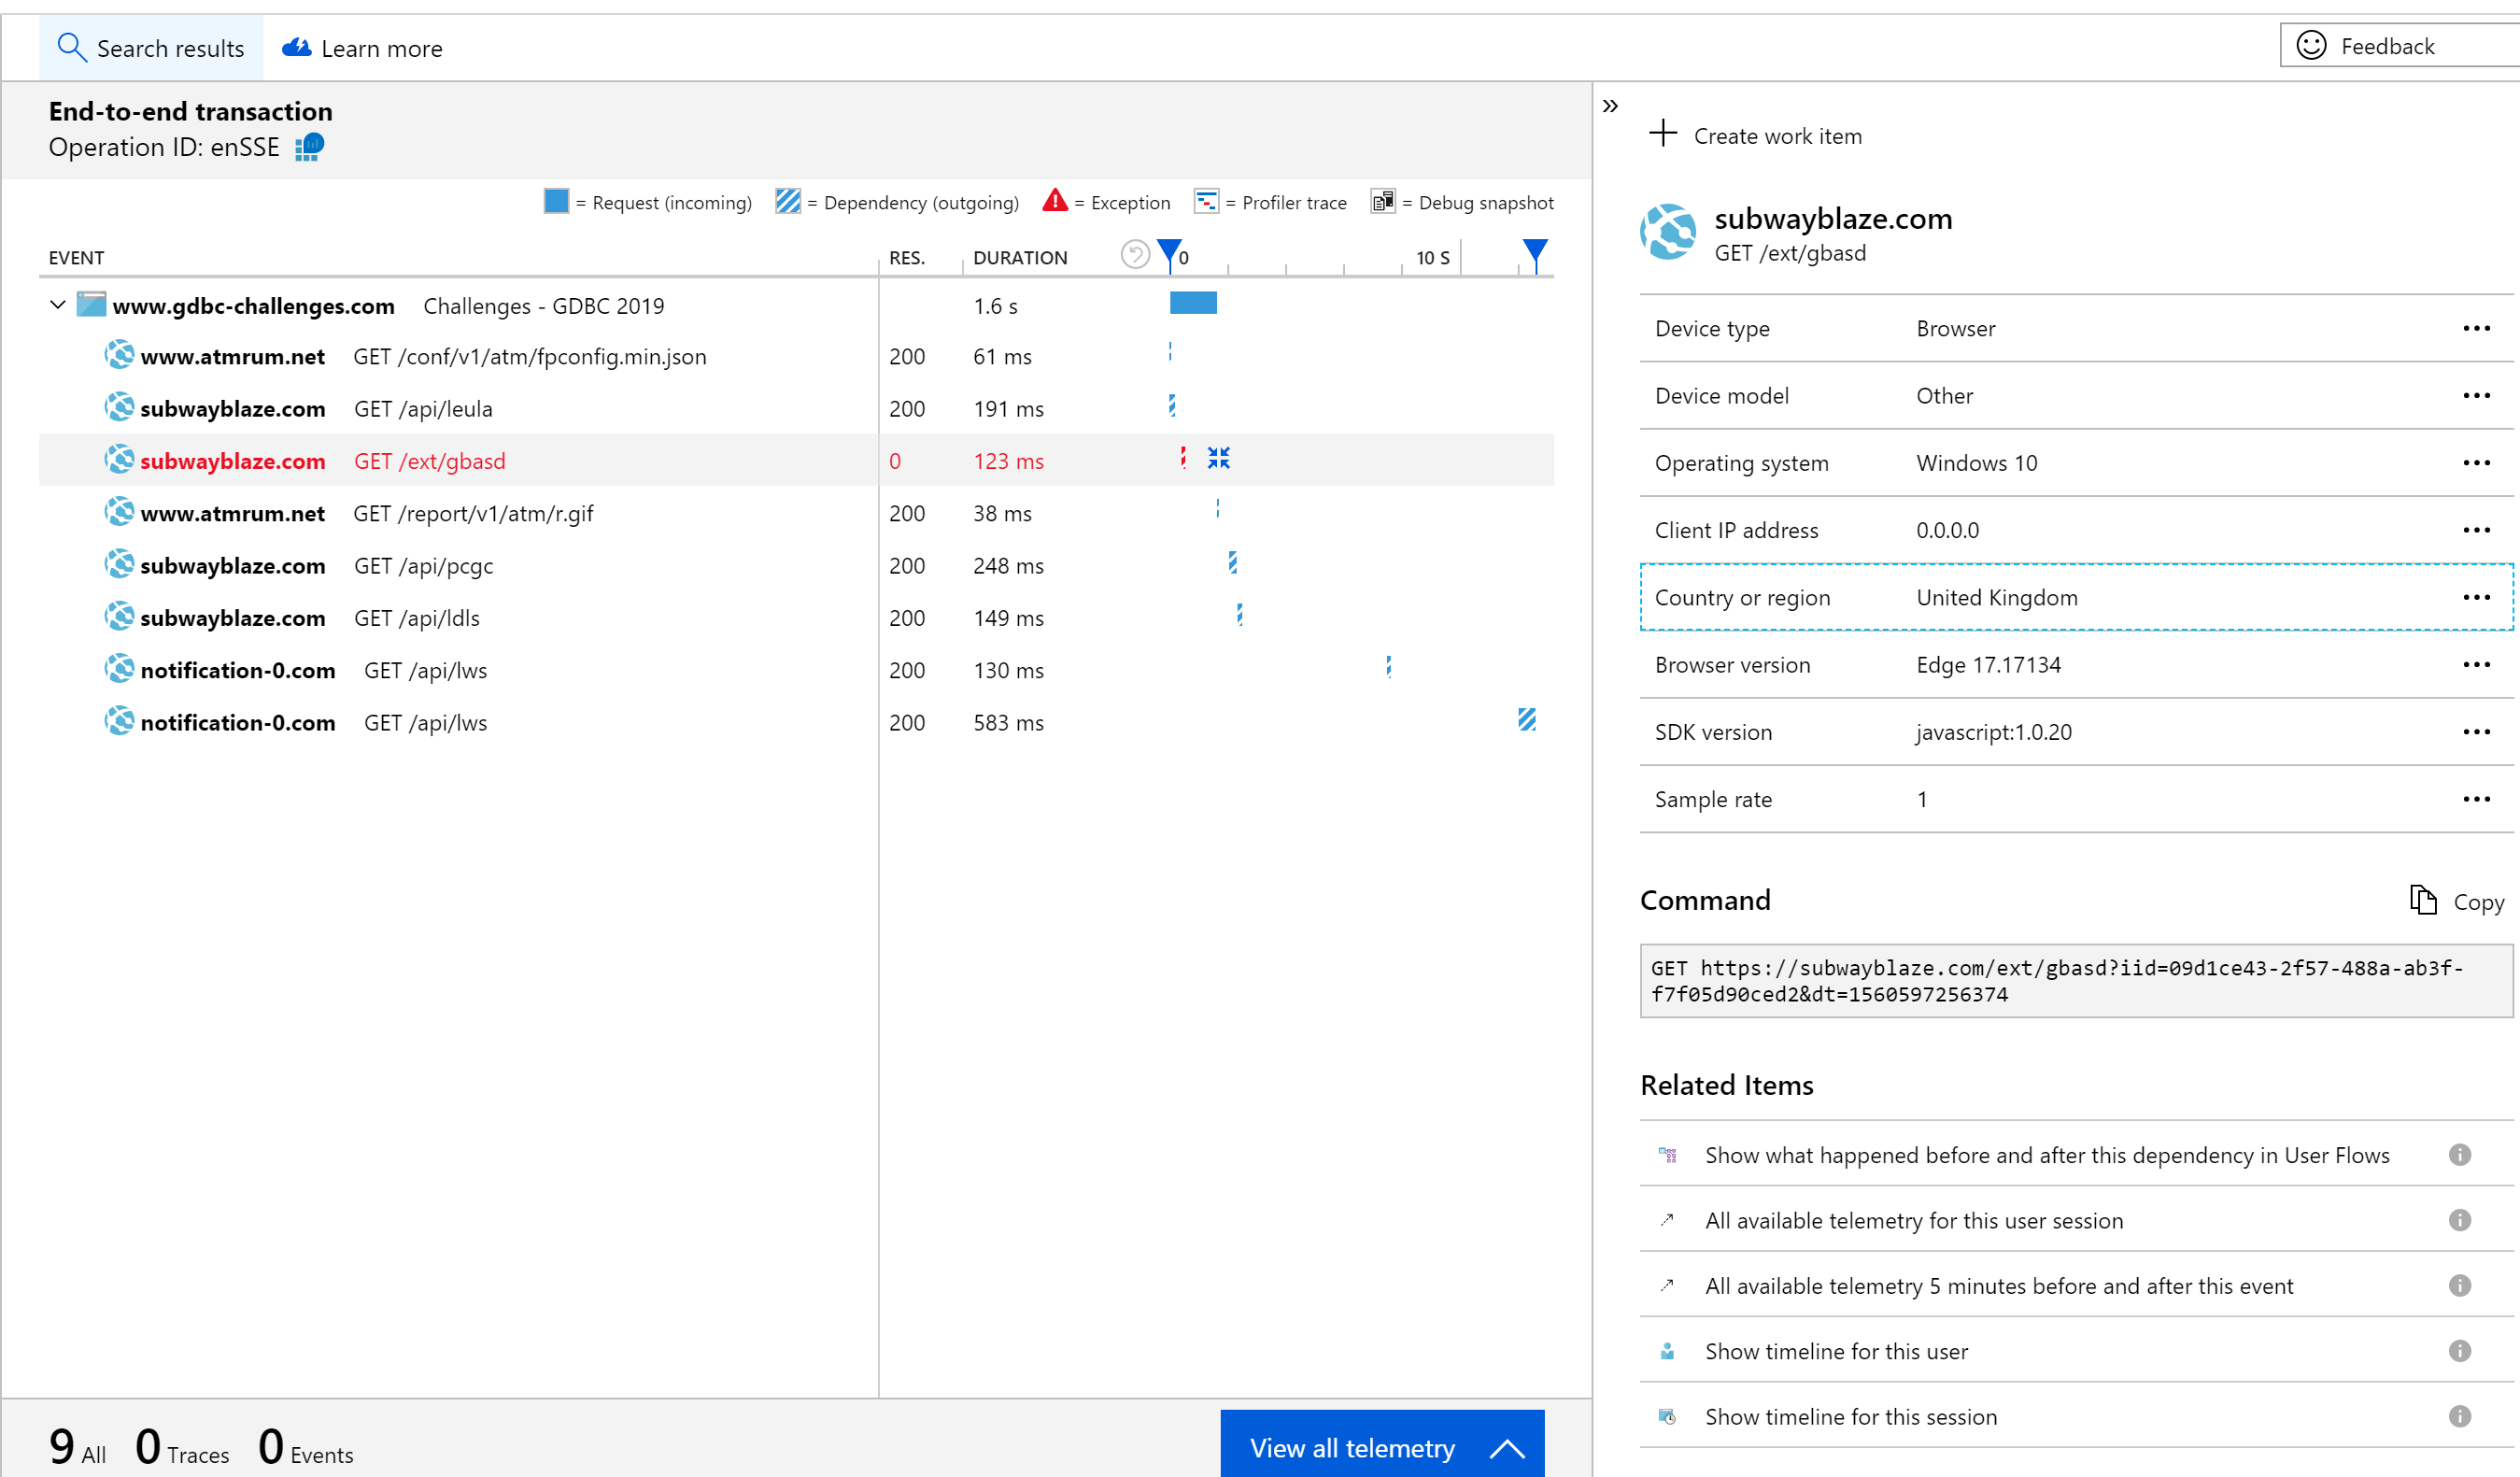
Most likely some user with a browser extension which is injecting code into the webpage and as such it is captured. Something we should have taken care of with some policies.
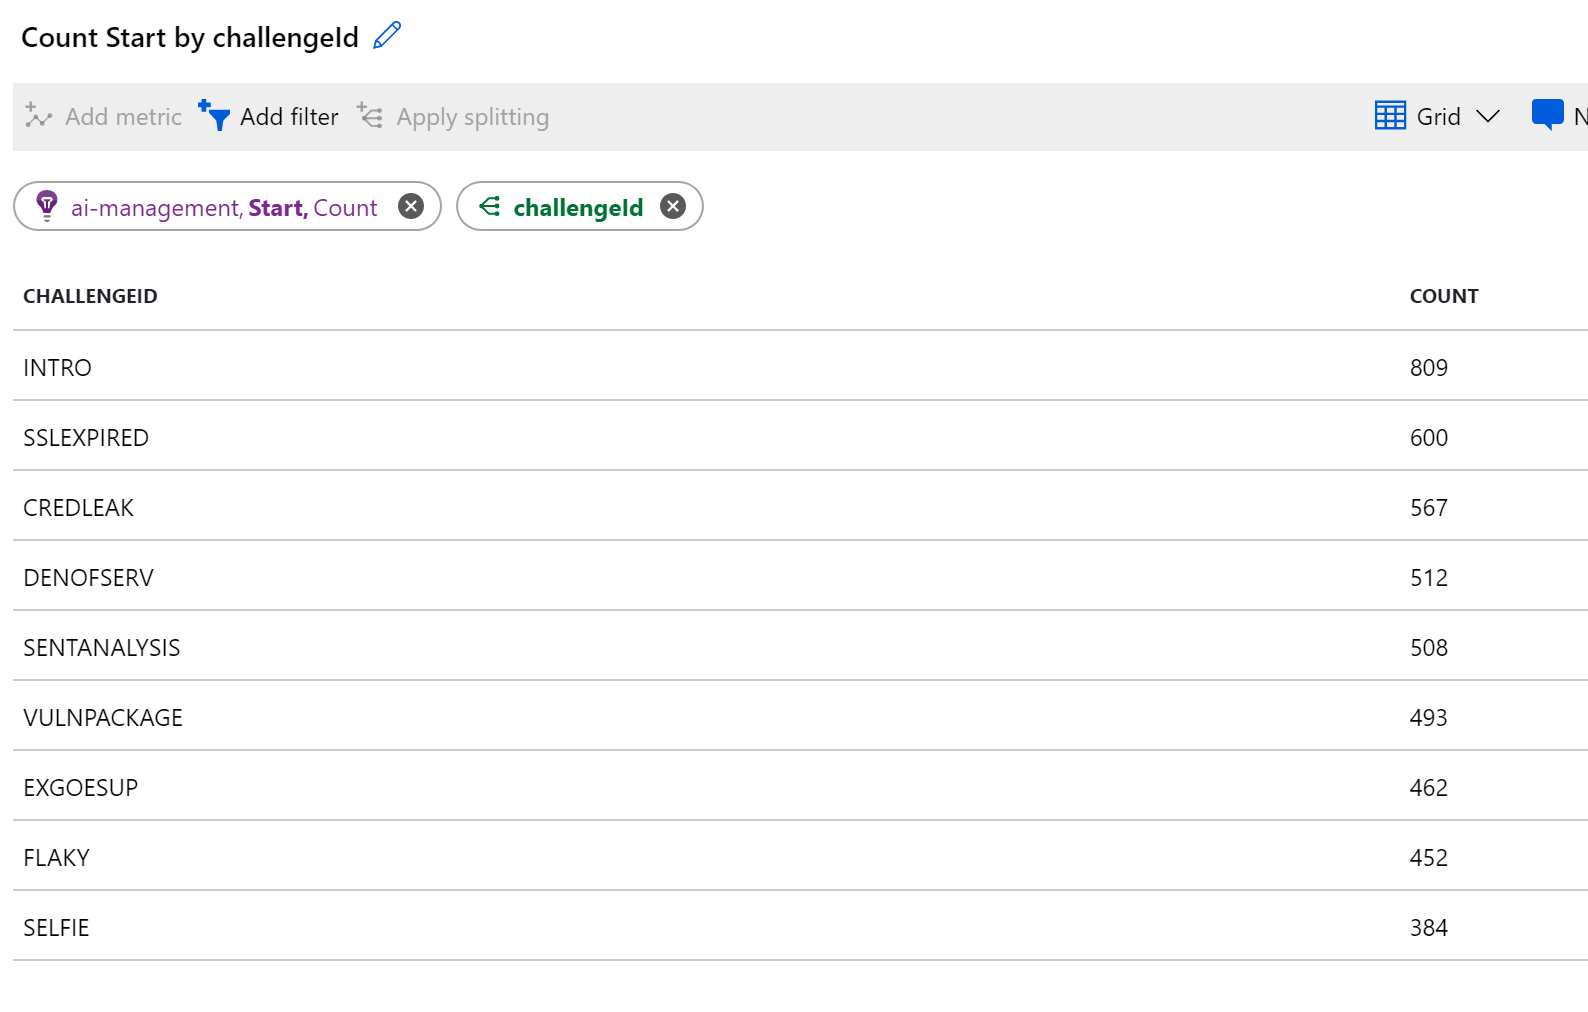
As we stored a lot of metrics, we can find out how many challenges are started etc.
The underlying infrastructure
The code has to run somewhere, and we had provisioned several components for this which we also needed to monitor. Most of the things were overprovisioned so we did not run into limits. Just before the event started, everything was bumped to a couple of more nodes or instances. After the event, we could quickly scale down again.
During the day, we had an eye open on the details of the Azure Kubernetes Services
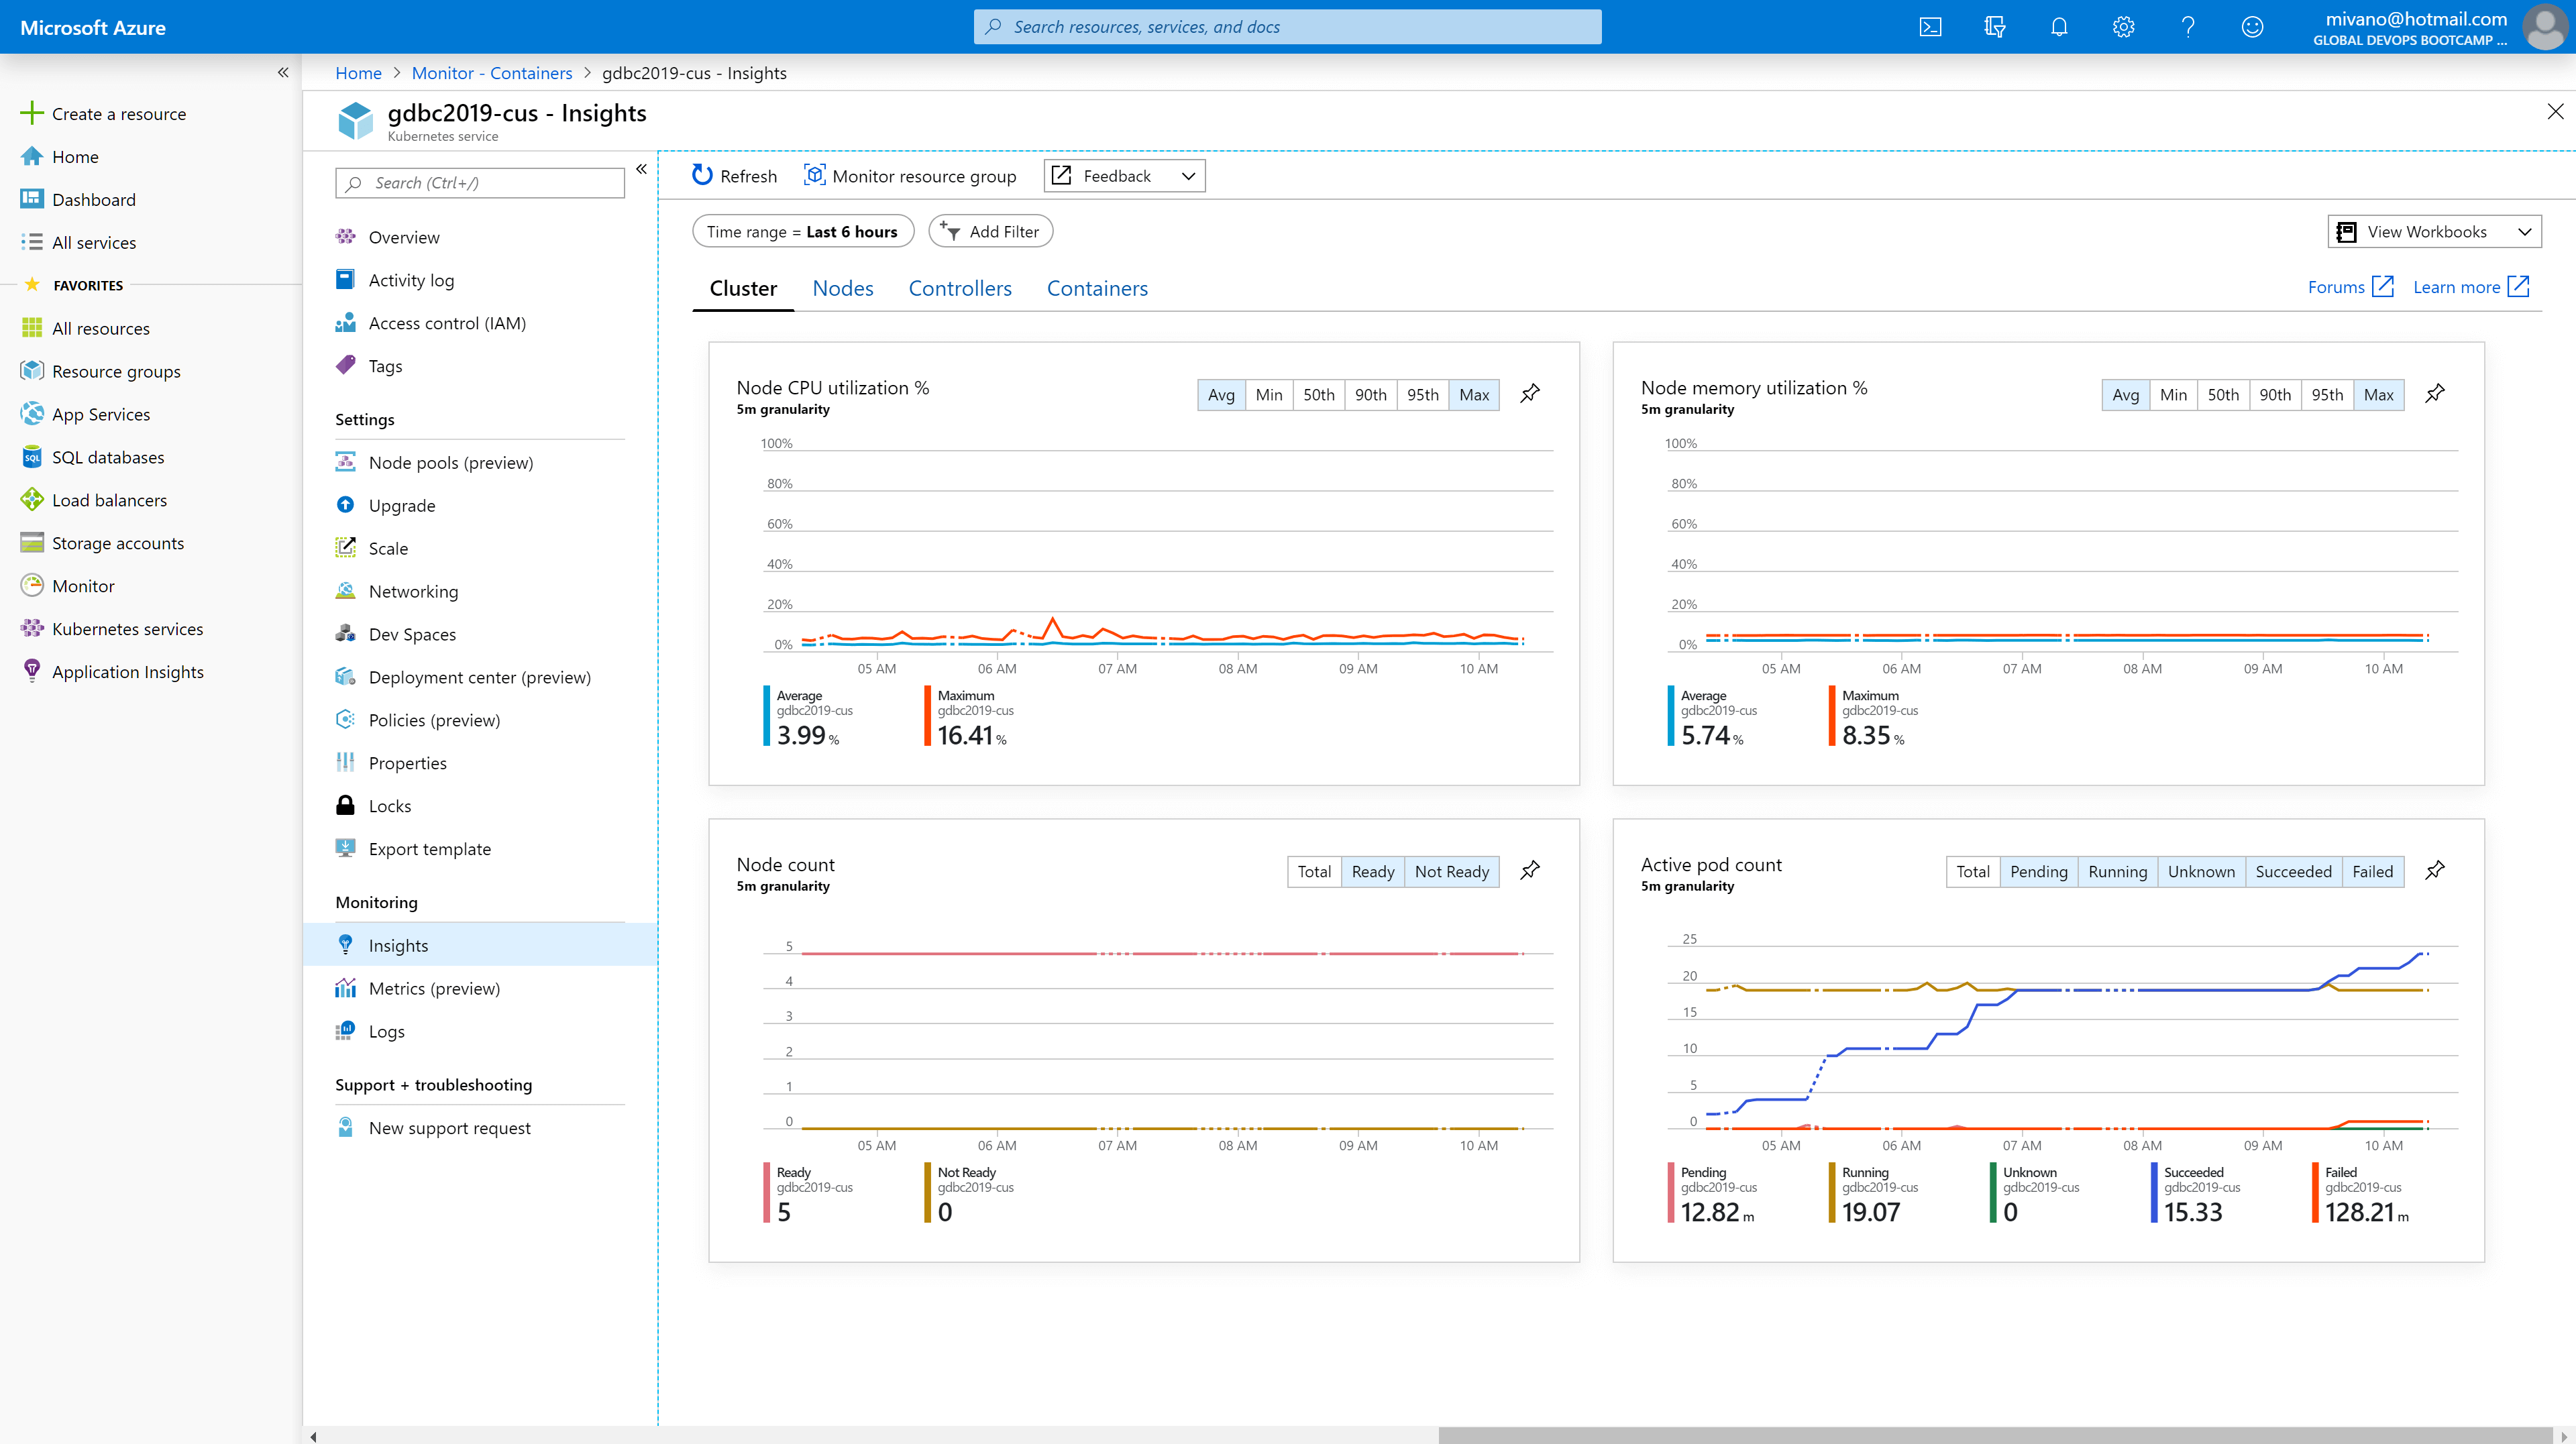
Checking if we still had enough CPU and memory available and if pods were terminated successfully.
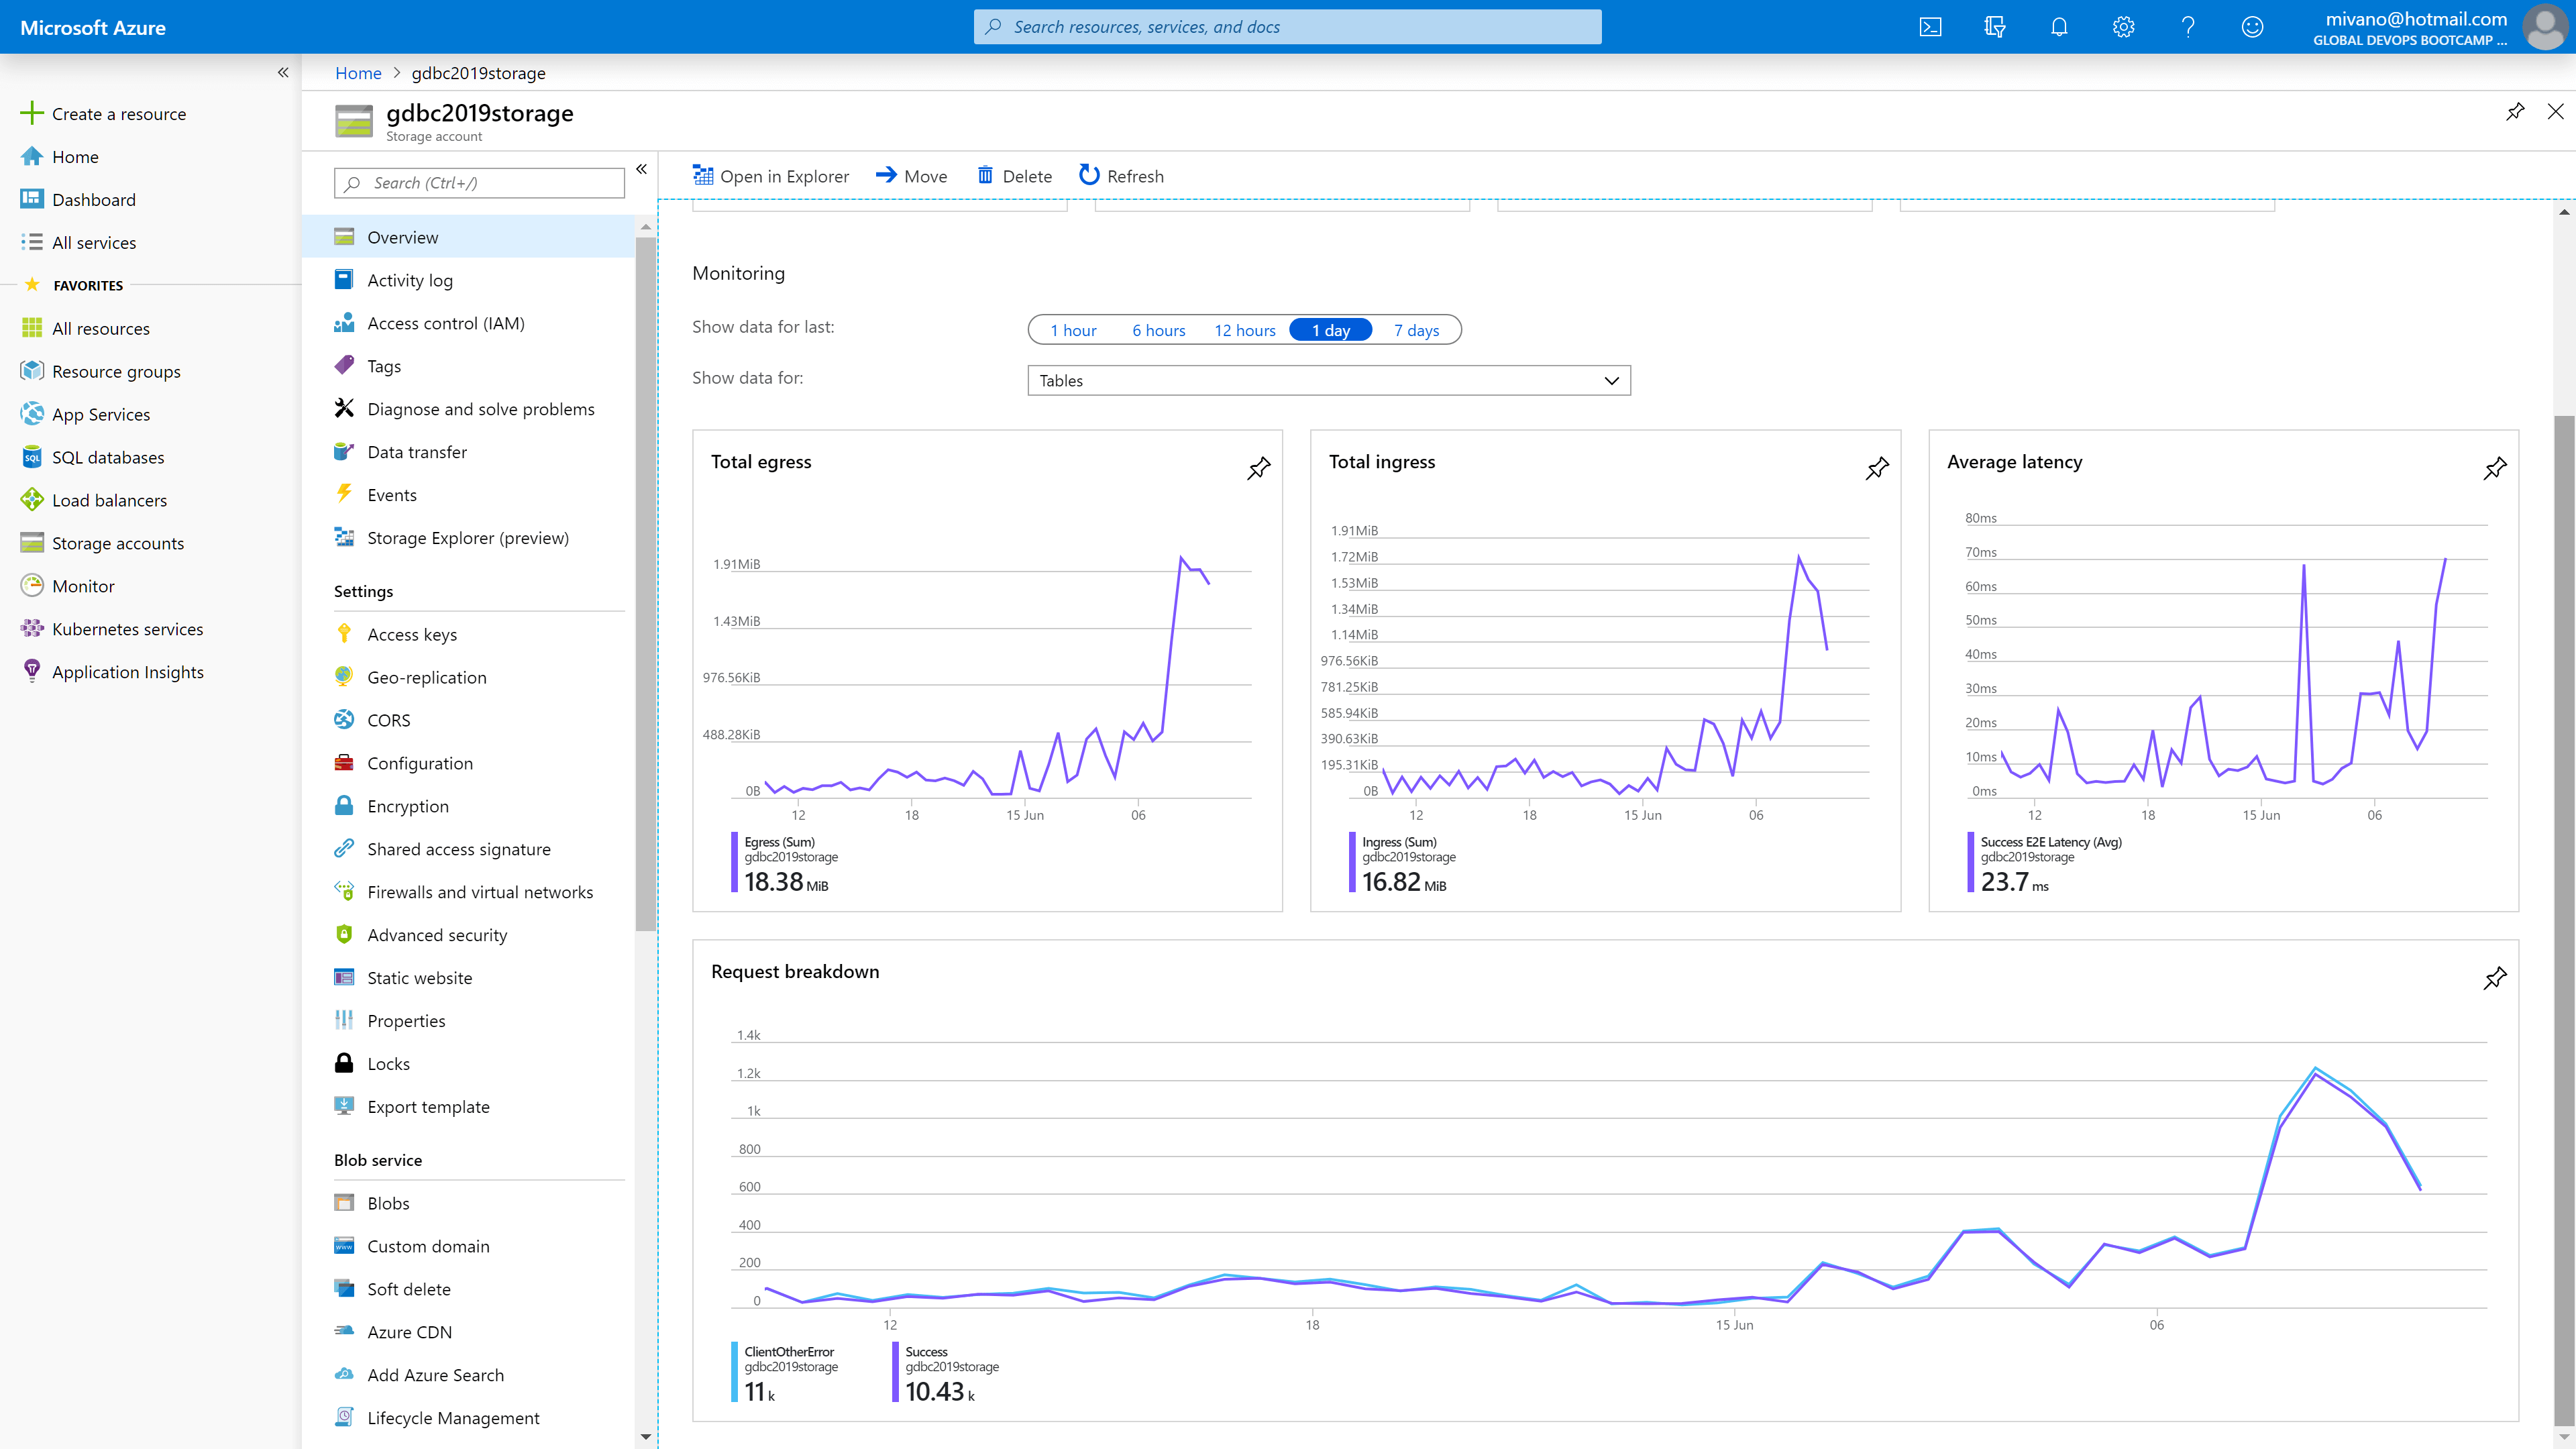
We also looked at the storage account, used to save the state of the teams in, but also their settings. This was only hosted inside the West Europe region, which was a little bit of a concern if it was fast enough for the other regions:
And the servicebus, which was used to enqueue the challenges:
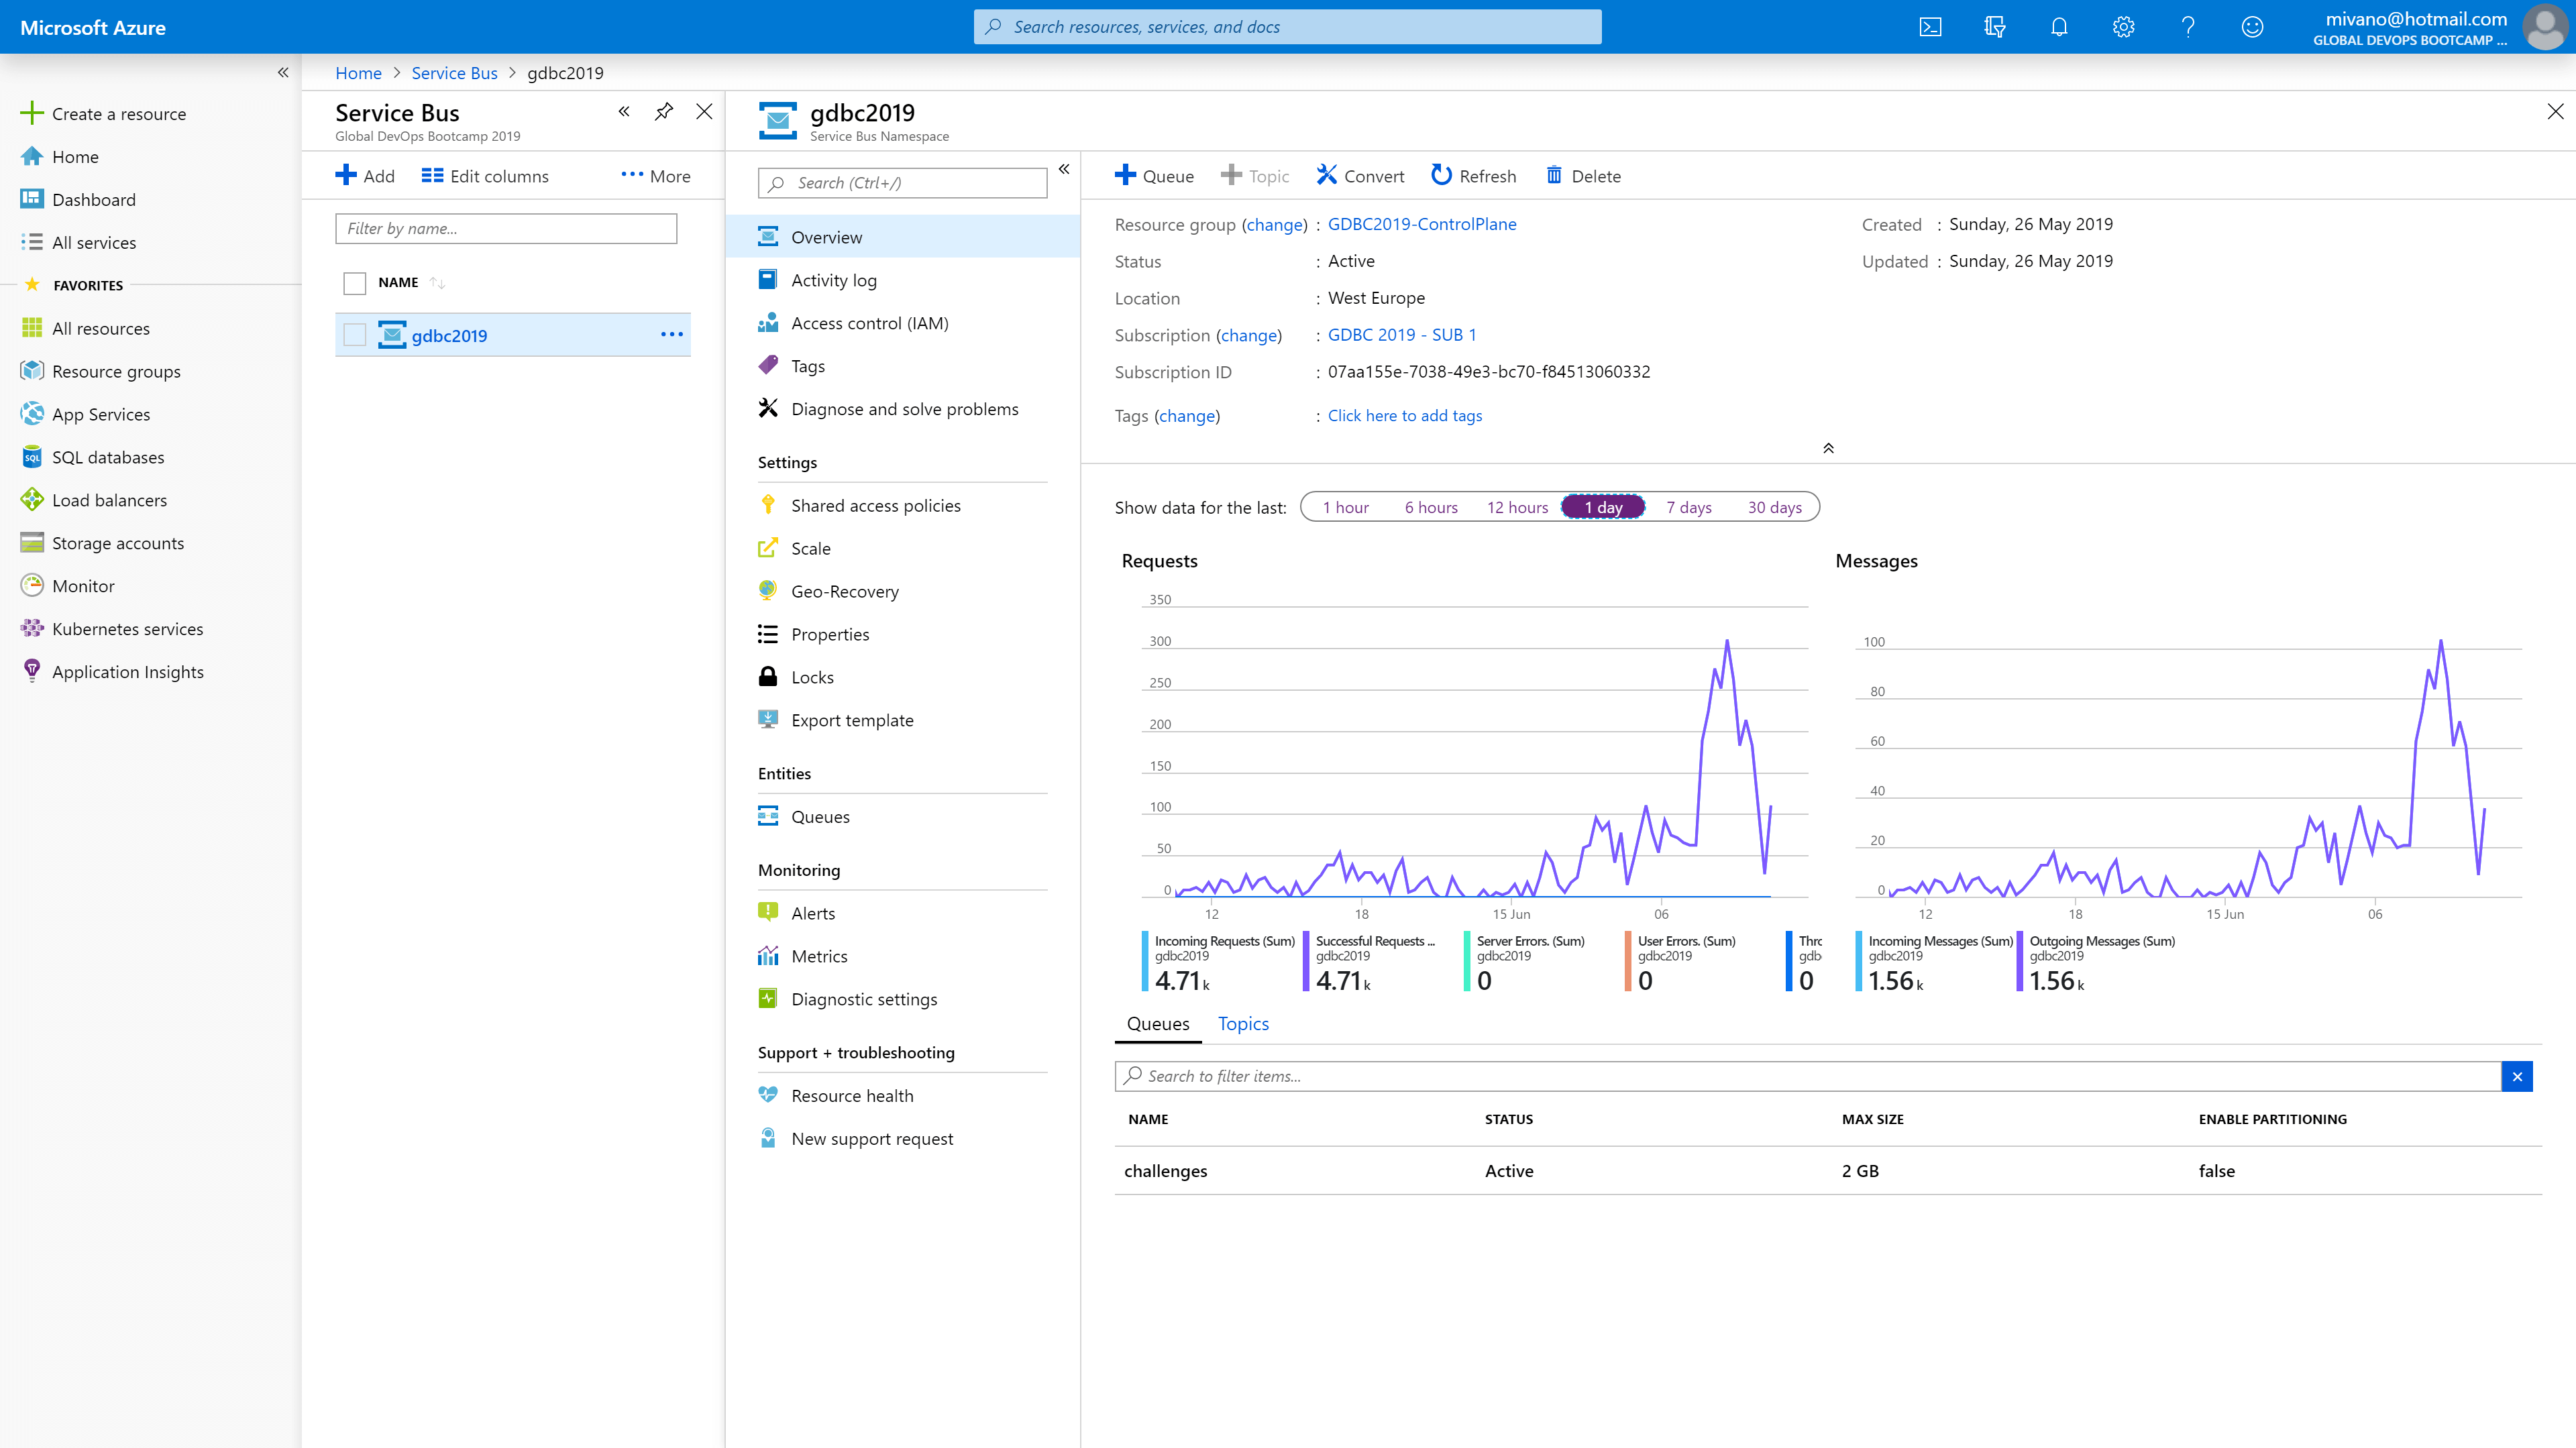
Making sure the queues were emptied quickly enough. We had four regions with each three deployed web applications capable of enqueueing items, but only one region with three competing consumers processing the load.
Conclusion
As you can see, we focussed heavily on monitoring so we could provide an event that would run smoothly. Using the right metrics, we can validate this and analyze what was used or where issues occurred. Tooling like Application Insights and Google Analytics are very useful for this.


Leave a comment